
Abstract
Background
As COVID-19 immunomodulation has been a part of interest for studies, it has been found that severe coronavirus disease 2019 (COVID-19) is associated with hyper-inflammatory response and increased levels of interleukin-6 (IL-6) and interleukin-10 (IL-10). This can progress to cytokine storm syndrome and eventually development of acute respiratory distress syndrome (ARDS). Interleukin-1 receptor antagonist (IL-1RA) is a protein that is a member of the interleukin 1 cytokine family. Monocyte chemoattractant protein 1 (MCP1) is a small cytokine that belongs to the CC chemokine family. Interferon gamma-induced protein 10 (IP-10) is a protein secreted by several cell types in response to Interferon-Gamma (IFN-γ). All of these have roles in the immune response and eventually development of a cytokine storm.
Methods
Serum levels of IL-1RA, MCP-1 and IP-10 were measured in a cohort of 21 patients infected with severe acute respiratory syndrome coronavirus 2 (SARS-CoV-2) on admission to a tertiary care hospital in Riyadh, Saudi Arabia, as well as in an approximately age-sex matched group of 4 uninfected controls. The study population was classified into severe, moderate, mild and controls.
Results
Serum levels of IL-1RA, MCP-1 and IP-10 were found to be elevated before the clinical deterioration.
Conclusion
These cytokines may play a role in early detection of disease severity especially in the pre-storm phase. Medications that target cytokines may prevent the development of an overt cytokine storm.
Author Contributions
Academic Editor: Shimaa M Motawei, Egypt
Checked for plagiarism: Yes
Review by: Single-blind
Copyright © 2022 Mayyadah H. Alabdely, et al.
 This is an open-access article distributed under the terms of the Creative Commons Attribution License, which permits unrestricted use, distribution, and reproduction in any medium, provided the original author and source are credited.
Competing interests
The authors have declared that no competing interests exist.
Citation:
Background
COVID-19 is a global Pandemic with cases surpassing two hundred million cases worldwide and a mortality of over 4 million, the mortality rate reached approximately 2% worldwide 1. COVID-19 is preponderantly mild and self-limiting with rapidly developing anti-viral immunity. By contrast, progression to a well characterized cytokine release syndrome resulting in acute lung injury or acute respiratory distress syndrome in critical cases with a high case fatality ratio occurs in many elderlies and in the presence of comorbidities, like other (seasonal) viral infections 2, 3, 4. Studies found that patients with severe illness had lower levels of CD4+ and CD8+ T cells and higher levels of plasma IL-6 IL-10 compared with patients with mild illness, indicating that a cytokine storm is a pathogenesis in severe COVID-19 2. Host-pathogen interactions, distinct immunotypes and immune signatures are determinants of pathogenesis and correlate with outcomes of COVID-19 5, 6, 7. A fulminant cytokine release syndrome or storm, including common protagonists of inflammation such as IL-1β, IL-1Ra, IL-2, IL-6, IL-7, IL-8, IL-9, IL-10, basic FGF, G-CSF, GM-CSF, IFN-γ, IP-10, MCP-1, MIP-1α, MIP-1β, PDGF, VEGF and TNF-α, is made responsible for life-threatening respiratory failure and multi-organ dysfunction or failure 1. Regarding outcome, the principal known predictors of mortality are advanced age, comorbidities such as diabetes, hypertension, cardiac disease, chronic lung disease, chronic kidney disease, cerebrovascular disease, dementia, mental disorders, immunosuppression, obesity and cancer, and laboratory parameters, i.e., CRP, LDH, cardiac troponin I, ferritin, D-dimers, and raised levels of IP-10, IL-10, IL-1Ra, IL-6, as well as lymphopenia 8, 9, 10, 11, 12, 13, 14. In combination with the clinical presentation and radiographic findings, some of these variables have been used to develop various prognostic models for risk stratification of patients admitted to hospital with COVID-19, but a universally accepted and applicable scoring system has yet not been established 15.
IL-1Ra and IL-10, biomarkers of disease severity in COVID-19, might be a useful prognostic biomarker to guide treatment strategies 16. Recent clinical studies found that patients with severe illness had lower levels of CD4+ and CD8+ T cells and higher levels of plasma IL-6 and IL-10 compared with patients with mild illness 1,17. This combination was associated with reduced patient survival, suggesting that these cytokines may have an important role in viral pathogenesis 2. This has been described as a “cytokine storm,” reflecting an overproduction of immune and inflammatory cells, as well as their cytokines 2, 8. It is thought that a cytokine storm may be an important cause of acute respiratory distress syndrome 1, 2, 8.
With the intention to explore whether some of those markers could be clinically useful for predicting the development of cytokine storm, we determined the blood levels of IL-1RA, MCP-1 and IP-10 in patients with COVID-19 who were admitted to a tertiary care hospital in Riyadh, Saudi Arabia. Cases were divided according to the disease severity into mild, moderate, and severe. For comparison, IL-1RA, MCP-1 and IP-10 levels were also measured in an approximately age-sex matched healthy control group. Longitudinal analysis was performed to demonstrate the dynamics of cytokine and chemokine production associated with disease progression to severe disease. This may help further clarify the mechanism of immune response to COVID-19 infection, to guide more effective interventions for managing patients with severe illness.
Methods
Settings
We conducted an observational study at the King Faisal Specialist Hospital and Research Centre (KFSHRC), a large (~1.000.000 outpatient visits/year, 1.600 beds, ~1.000 physicians and ~13.500 employees), non-profit, tertiary referral hospital, located in the city center of Riyadh, Saudi Arabia, where patients are referred from other hospitals from across Saudi Arabia and adjacent regions. Participants were included consecutively in the period from March 1st to March 31st, 2020. All patients were Saudi nationals and were self-referrals, as these participants were long-term patients and therefore have direct access to health care in this hospital. The diagnosis of COVID-19 was suspected clinically and confirmed through the detection of SARS-Cov-2 in a nasopharyngeal sample with specific PCR (RealStar® SARS-CoV-2 RT-PCR Kit RUO altona-diagnostics, Germany), which was performed in the Section of Medical Microbiology of the Department of Pathology and Laboratory Medicine at KFSHRC. Upon testing positive, the patients were admitted and isolated in negative pressure rooms. Severity of disease, i.e., mild, moderate, or severe was determined on admission and modified according to the clinical course using the WHO categories of COVID-19 disease severity 18. These are defined as follows: mild disease, no evidence of viral pneumonia or hypoxia; moderate disease, clinical signs of pneumonia (fever, cough, dyspnea, fast breathing), but not severe pneumonia, including SpO2 ≥ 90% on room air, cautioning that a SpO2 of >90–94% on room air is abnormal in a patient with normal lung and can be an early sign of severe disease. Severe disease, clinical signs of pneumonia (fever, cough, dyspnea, fast breathing) plus one of the following: respiratory rate >30 breaths/min, severe respiratory distress or SpO2 <90% on room air. Chest imaging (radiograph, CT scan, ultrasound) may assist in diagnosis and identify or exclude pulmonary complications in moderate and severe disease. For comparison, we also determined IL-1RA, MCP-1 and IP-10 levels and other parameters in a group of approximately age-sex matched controls without evidence of any infection who were recruited from hospital personnel, trainees, or patients.
Data Sources
Clinical, laboratory and radiographic data were handled viathe electronic medical records system (PowerChart; Cerner, USA), and included demographic details, vital signs, admission notes with chief complaint(s), history of present illness, previous diagnoses, medications, laboratory tests, radiography, and progress notes. These data were extracted from the electronic medical records, deposited, and further processed using REDCap 19. Within this project, each participant patient was assigned a unique research-specific ID number that was password-protected. Data were exported from REDCap into a Microsoft Excel spreadsheet.
Variables Assessed
For each patient with COVID-19, the following data at the time of admission to the hospital were obtained and recorded electronically: age, sex, vital signs including SpO2, presenting symptom(s), comorbidities, medications, laboratory tests and chest X-ray. Laboratory investigations included complete blood count (CBC), absolute counts of CD3+, CD3+CD4+ and CD3+CD8+ T cells, CD19+ B cells, CD56+CD16+ NK cells, Beta-2 microglobulin, IL-1RA, MCP-1, IP-10, Tumor Necrosis Factor alpha (TNF-α), ferritin, D-dimer, CRP, estimated glomerular filtration rate (eGFR, CKD-EPI equation) 20. In the control group, after exclusion of an infectious disease, the same hematologic and biochemical parameters were measured.
Quantification of IL-1RA, MCP-1, IP-10, Ferritin, D-Dimer, and CRP Levels
The tests for IL-1RA, MCP-1, IP-10, ferritin, D-dimer, and CRP were performed within two days of admission in the Medical Laboratory of the Department of Pathology and Laboratory Medicine at KFSHRC. Serum IL-1RA, MCP-1, and IP-10 levels were quantified using a highly standardized Luminex assay. Serum levels of ferritin were determined by electrochemiluminescence immunoassay (Elecsys Ferritin1) using streptavidin-coated microparticles, biotinylated mouse monoclonal anti-ferritin antibody and ruthenium-complex-labeled mouse monoclonal anti-ferritin antibody on the Roche/Hitachi cobas1 e 801 immunoassay analyzers (measuring range: 0.50–2000 μg/l; reference range for men: 30–400 μg/l; for women: 13–150 μg/l). D-dimer levels were determined in plasma with an immunoturbidometric assay (STA1-Liatest1 D-DI PLUS) using latex microparticles coated with two different mouse monoclonal anti-D-dimer antibodies (normal level < 0.5 μg/ml FEU) and analyzed on the STA-R1 Max2 instrument. CRP levels were measured in serum using an immunoturbidometric assay with latex particles coated with mouse monoclonal anti-CRP antibody (CRPHS1) on the Roche/Hitachi cobas1 c system (measuring range: 0.15–20.0 mg/l). For this high-sensitivity CRP assay, levels >10 mg/l indicate systemic inflammation.
Statistical Analysis
Tabulations, analysis of variance (ANOVA) including linear trend tests, ordinal logistic regression (proportional odds model, stepwise manually, backward selection, p-value based, p_out = 0.05), and Spearman rank correlation coefficient were used. A significance level (2-tailed) of 0.05 was used throughout. Normally distributed measurement data were expressed as the mean ± Standard Deviation (SD) and were analyzed by variance analysis, a P value < 0.05 indicates statistical significance. As the distribution of CRP levels was highly skewed, its values were 10log transformed. Analyses were carried out with SPSS v.22 (IBM SPSS Statistics for Windows, Version 22.0. Armonk, NY: IBM Corp).
Results
Patients’ Characteristics
Demographic characteristics, main comorbidities, clinical manifestations, medications, and vital signs on presentation are shown in Table 1. Twenty-one consecutive participants (mean age 49 ± 22; 9 m, 12 f) presented to the emergency department with one or more of the following chief complaints (in descending order of frequency): fever, dry cough, sore throat, rhinorrhea, fatigue, headache, diarrhea, anosmia, productive cough, dyspnea, ear pain, ageusia, anorexia, abdominal pain, nausea, emesis, seizure, syncope, myalgia, rash, and no symptoms. Fever and dry cough were the principal manifestations in all patients, whereas other symptoms varied among severity groups. Among the patients, comorbidities were as follows: hypertension, diabetes mellitus, dyslipidemia, coronary artery disease, congestive heart failure, atrial fibrillation, chronic obstructive pulmonary disease, cerebrovascular disease, leukemia in remission, colorectal cancer in remission, post-renal transplant, Hodgkin’s lymphoma in remission, and hypothyroidism.
Table 1. Demographic characteristics, comorbidities, clinical manifestations, medications, and vital signs in patients admitted to the hospital with COVID-19.| All patients (n=21) | Mild (n=6) | Moderate (n=9) | Severe (n= 6) | |
| Age (years), mean (±SD) | 49.7 (22.3) | 29 (7.4) | 47 (18. 2) | 74.6 (11.3) |
| Range | 20 – 90 | 20 – 41 | 27 – 79 | 54 – 90 |
| Age by group, n (%) | ||||
| <40 | 9 (42.8) | 5 (83.3) | 4 (44.4) | 0 (0) |
| 40 – 59 | 5 (23.8) | 1 (16.6) | 3 (33.3) | 1 (16.6) |
| 60 - 80 | 5 (23.8) | 0 (0) | 2 (22.2) | 3 (50) |
| 80+ | 2 (9.5) | 0 (0) | 0 (0) | 2 (33.3) |
| Sex, n (%) | ||||
| Male | 9 (42.8) | 2 (33.3) | 2 (22.2) | 5 (83.3) |
| Female | 12 (57.1) | 4 (66.6) | 7 (77.7) | 1 (16.6) |
| Comorbidities, n (%) | ||||
| Hypertension | 8 (38) | 0 (0) | 3 (33.3) | 5 (83.3) |
| Diabetes | 5 (23.8) | 0 (0) | 2 (22.2) | 3 (50) |
| Dyslipidemia | 3 (14.2) | 0 (0) | 0 (0) | 3 (50) |
| Coronary Artery Disease | 3 (14.2) | 0 (0) | 0 (0) | 3 (50) |
| Congestive Heart Failure | 2 (9.5) | 0 (0) | 0 (0) | 2 (33.3) |
| COPD | 2 (9.5) | 0 (0) | 0 (0) | 2 (33.3) |
| Atrial Fibrillation | 2 (9.5) | 0 (0) | 1 (11.1) | 1 (16.6) |
| Cerebrovascular Disease | 1 (4.7) | 0 (0) | 0 (0) | 1 (16.6) |
| Other | 11 (52.3) | 4 (66.6) | 4 (44.4) | 3 (50) |
| Symptoms at presentation, n (%) | ||||
| Fever | 7 (33.3) | 1 (16.6) | 3 (33.3) | 3 (50) |
| Dry Cough | 14 (66.6) | 3 (50) | 7 (77.7) | 4 (66.6) |
| Sore throat | 6 (28.5) | 3 (50) | 3 (33.3) | 0 (0) |
| Rhinorrhea | 5 (23.8) | 2 (33.3) | 2 (22.2) | 1 (16.6) |
| Fatigue | 5 (23.8) | 1 (16.6) | 2 (22.2) | 2 (33.3) |
| Headache | 4 (19) | 1 (16.6) | 2 (22.2) | 1 (16.6) |
| Diarrhea | 2 (9.5) | 0 (0) | 2 (22.2) | 0 (0) |
| Anosmia | 2 (9.5) | 1 (16.6) | 1 (11.1) | 0 (0) |
| Productive cough | 2 (9.5) | 0 (0) | 0 (0) | 2 (33.3) |
| Dyspnea | 0 (0) | 0 (0) | 0 (0) | 0 (0) |
| Otalgia | 1 (4.7) | 0 (0) | 0 (0) | 1 (16.6) |
| Ageusia | 0 (0) | 0 (0) | 0 (0) | 0 (0) |
| Anorexia | 0 (0) | 0 (0) | 0 (0) | 0 (0) |
| Nausea | 0 (0) | 0 (0) | 0 (0) | 0 (0) |
| Vomiting | 1 (4.7) | 0 (0) | 0 (0) | 1 (16.6) |
| Abdominal pain | 0 (0) | 0 (0) | 0 (0) | 0 (0) |
| Seizure | 1 (4.7) | 0 (0) | 0 (0) | 1 (16.6) |
| Syncope | 1 (4.7) | 0 (0) | 0 (0) | 1 (16.6) |
| Myalgia | 0 (0) | 0 (0) | 0 (0) | 0 (0) |
| Rash | 0 (0) | 0 (0) | 0 (0) | 0 (0) |
| Asymptomatic | 1 (4.7) | 0 (0) | 0 (0) | 1 (16.6) |
| Medications, n (%) | ||||
| Beta-Blocker | 5 (23.8) | 0 (0) | 1 (11.1) | 4 (66.6) |
| ACEI or ARB | 5 (23.8) | 0 (0) | 1 (11.1) | 4 (66.6) |
| Oral Hypoglycemic | 4 (19) | 0 (0) | 2 (22.2) | 2 (33.3) |
| Diuretic | 3 (14.2) | 0 (0) | 0 (0) | 3 (50) |
| Anticoagulant | 2 (9.5) | 0 (0) | 0 (0) | 2 (33.3) |
| Antidepressant | 0 (0) | 0 (0) | 0 (0) | 0 (0) |
| Immunosuppressant | 1 (4.7) | 0 (0) | 0 (0) | 1 (16.6) |
| Antiepileptic | 1 (4.7) | 0 (0) | 0 (0) | 1 (16.6) |
| Other | 11 (52.3) | 2 (33.3) | 6 (66.6) | 3 (50) |
| Vitals at presentation, mean (±SD) | ||||
| Temperature | 37.1 (0.56) | 36.9 (0.40) | 37.1 (0.44) | 37.4 (0.68) |
| Heart Rate | 84 (13.8) | 83 (12.2) | 88 (14.2) | 79 (12.9) |
| Systolic Blood Pressure | 123 (17.9) | 108 (10.4) | 130 (20.5) | 127 (11.9) |
| Diastolic Blood Pressure | 74 (11) | 68 (5.4) | 81 (13.6) | 72 (4.9) |
| Respiratory Rate | 20 (2.1) | 19 (0.7) | 20 (0.6) | 21 (3.4) |
| O2 saturation | 96% (2.5) | 97% (1.2) | 96% (1.5) | 94% (3.5) |
| BMI | 27.7 (4.2) | 26.9 (3.4) | 28.9 (4.6) | 28.1 (6.2) |
Outcome Data
To compare cytokine expression levels between COVID-19 patients and controls, plasma cytokine levels were measured using Luminex in 4 patient groups: severe COVID-19 (n = 6), moderate COVID-19 (n = 9), Mild COVID-19 (n = 6), and controls (n = 4). Leukocyte profile, CRP, Ferritin and Beta 2 microglobulin were also measured (figure 1). Beta-2 microglobulin was elevated in severe patients, compared to moderate, mild and controls (P <0.001) Figure 2. IP-10 level was significantly elevated in severe COVID-19 patients, in comparison to controls, mild and moderate (P< 0.0103), (P< 0.0188), (P< 0.0448) respectively. IL-1RA was also significant elevated in severe patients in comparison with other groups (figure 3). TNFA was significantly elevated in the severe COVID-19 patients’ group, compared to controls, mild, and moderate groups (P< 0.001) (Figure 4). Those biomarkers were obtained before the clinical deterioration and development of cytokine storm and ARDS, which indicate that those cytokines may play a role in early detection and recognition of severe COVID-19 disease and risk of development of cytokine storm.
Figure 1.β2-m levels in COVID-19 patients on admission to the hospital. Serum β2-m levels (mg/l) measured at the time of first SARS-Cov-2 detection are shown in relation to the disease severity in 6 patients with severe, 9 patients with moderate, 4 patients with mild, and 4 approximately age-sex matched uninfected controls.
| Tukey's multiple comparisons test | Mean Diff. | 95.00% CI of diff. | Adjusted P Value |
| Severe vs. Moderate | 2.903 | 1.334 to 4.473 | 0.0002 |
| Severe vs. Mild | 3.852 | 2.048 to 5.655 | <0.0001 |
| Severe vs. Control | 4.274 | 2.352 to 6.197 | <0.0001 |
| Moderate vs. Mild | 0.9483 | -0.7128 to 2.609 | 0.4021 |
| Moderate vs. Control | 1.371 | -0.4188 to 3.160 | 0.1736 |
| Mild vs. Control | 0.4225 | -1.575 to 2.420 | 0.9333 |
Figure 2.IP-10 levels in COVID-19 patients on admission to the hospital. IP-10 levels measured at the time of first SARS-Cov-2 detection are shown in relation to the disease severity in 6 patients with severe (red), 9 patients with moderate (green), 4 patients with mild (purple), and 4 approximately age-sex matched uninfected controls (black).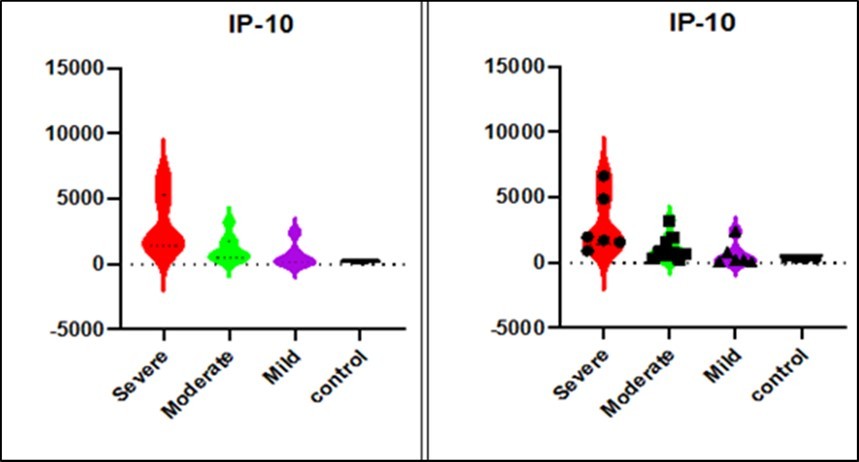
| Dunnett's multiple comparisons test | Mean Diff. | 95.00% CI of diff. | Significant? | Adjusted P Value | A-? | |
| Severe vs. Moderate | 1814 | 36.66 to 3592 | Yes | 0.0448 | B | Moderate |
| Severe vs. Mild | 2296 | 349.0 to 4244 | Yes | 0.0188 | C | Mild |
| Severe vs. control | 2710 | 532.4 to 4887 | Yes | 0.013 | D | control |
Figure 3.IL-1RA levels in COVID-19 patients on admission to the hospital. IL-1RA levels measured at the time of first SARS-Cov-2 detection are shown in relation to the disease severity in 6 patients with severe (red), 9 patients with moderate (green), 4 patients with mild (purple), and 4 approximately age-sex matched uninfected controls (black).
| Dunnett's multiple comparisons test | Mean Diff. | 95.00% CI of diff. | Significant? | Adjusted P Value | A-? | |
| severe vs. moderate | 60.6 | 23.27 to 97.94 | Yes | 0.0014 | B | moderate |
| severe vs. mild | 66.77 | 25.87 to 107.7 | Yes | 0.0013 | C | mild |
| severe vs. control | 70.62 | 24.89 to 116.3 | Yes | 0.0022 | D | control |
Figure 4.TNFA levels in COVID-19 patients on admission to the hospital. TNFA levels measured at the time of first SARS-Cov-2 detection are shown in relation to the disease severity in 6 patients with severe (red), 9 patients with moderate (green), 4 patients with mild (purple), and 4 approximately age-sex matched uninfected controls (black).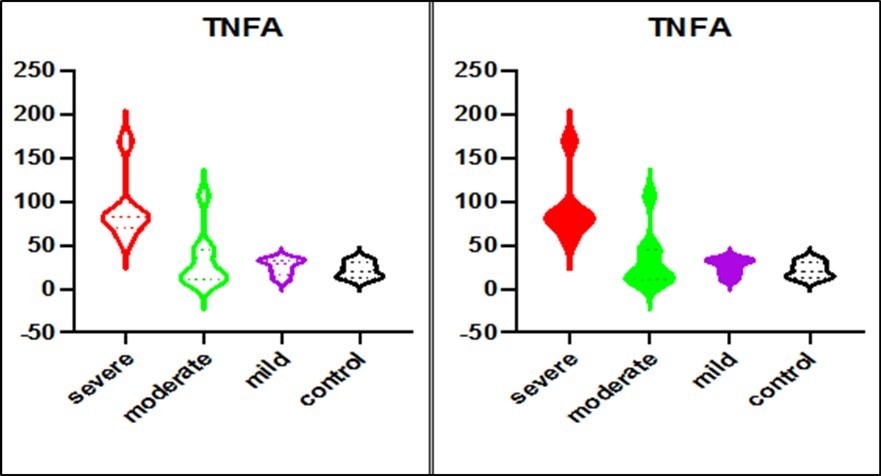
| Dunnett's multiple comparisons test | Mean Diff. | 95.00% CI of diff. | Significant? | Adjusted P Value | A-? | |
| severe vs. moderate | 60.6 | 23.27 to 97.94 | Yes | 0.0014 | B | moderate |
| severe vs. mild | 66.77 | 25.87 to 107.7 | Yes | 0.0013 | C | mild |
| severe vs. control | 70.62 | 24.89 to 116.3 | Yes | 0.0022 | D | control |
Discussion
In this study, we found that the early production of inhibitory mediators such as IL-1RA, IP-10 and MCP-1 were significantly associated with severe disease. This shows similarity to influenza virus infections, where similar associations with disease severity were also observed in both pandemic (pdm2009) H1N1 and avian H5N1 infections 21, 22, 23, 24. The IL-1RA is an early inhibitory cytokine that suppresses proinflammatory cytokines and T lymphocyte responses. IL-1RA is a cytokine that controls inflammatory responses during early stages of immune activation 25. Early IL-1RA production could affect induction of proinflammatory and antiviral cytokines during the early phase of COVID-19 infection. In mild cases, the inhibitory role of elevated IL-1RA may be overridden by the robust adaptive immune responses to the virus. However, in the severe cases, much higher levels of IL-1RA were observed in comparison with mild cases, suggestive of an overactive immune response, which may contribute to the switch from controlled and protective immune environment to inflammation-induced tissue damage. Serum levels of IL-1RA, MCP-1 and IP-10 were found to be elevated before the clinical deterioration, indicating that these cytokines may play a role in early detection of disease severity especially in the pre-storm phase. Medications that target cytokines may prevent the development of an overt cytokine storm.
Given the obvious limitations of a single-center study and the small sample size, larger cohorts, preferably in areas of the world other than the Arabian Peninsula, are needed to definitively assess the value of IL-1RA, IP-10 and MCP-1 levels as independent biomarkers of disease severity and predictors of outcomes with the advantage of having less fluctuations or extraneous influences than other parameters, such as iron stores for ferritin, coagulopathies for D-dimers and secondary bacterial infections for CRP.
Abbreviations
KFSHRC: King Faisal Specialist Hospital and Research Centre; COVID-19: Coronavirus Disease 2019; IL-6: Interleukin-6; IL-10: Interleukin-10; ARDS: Acute Respiratory Distress Syndrome; IL-1RA: Interleukin-1 receptor antagonist; MCP1: Monocyte chemoattractant protein 1; IP-10: Interferon gamma-induced protein 10; IFN-γ: Interferon-Gamma; SARS-CoV-2: severe acute respiratory syndrome coronavirus 2; CBC: complete blood count; TNF-α: Tumor Necrosis Factor alpha; eGFR: estimated glomerular filtration rate; SD: Standard Deviation.
Funding Source
No funding source to declare.
Ethical Approval Statement
The study was approved by the Hospital’s ethics committee, the Research Advisory Council (RAC No: 2201052) and written informed consent was obtained from all subjects.
References
- 1.Huang C. (2020) Clinical features of patients infected with 2019 novel coronavirus in Wuhan. , China. Lancet 395, 497-506.
- 2.Mehta P, McAuley D F, Brown M, Sanchez E, Tattersall R S et al. (2020) COVID-19: consider cytokine storm syndromes and immunosuppression. Epub 395(10229), 1033-1034.
- 3.Moore J B, June C H. (2020) Cytokine release syndrome in severe COVID-19. Science. Epub 2020 Apr 17. https://doi.org/10.1126/science.abb8925 PMID: 368(6490), 473-474.
- 4.Jester B J, Uyeki T M, Jernigan D B. (2020) Fifty Years of Influenza A(H3N2) Following the Pandemic of 1968. Am J Public Health. 110(5), 669-676.
- 5.Mathew D, Giles J R, Baxter A E, Oldridge D A, Greenplate A R et al. (2020) Deep immune profiling of COVID-19 patients reveals distinct immunotypes with therapeutic implications. , Science 369(6508), 8511.
- 6.Laing A G, Lorenc A, I Del Molino Del Barrio, Das A, Fish M et al. (2020) A dynamic COVID-19 immune signature includes associations with poor prognosis. Nat Med. Epub 26(10), 1623-1635.
- 7.Varghese P M, Tsolaki A G, Yasmin H, Shastri A, Ferluga J et al. (2020) Host-pathogen interaction in COVID-19: Pathogenesis, potential therapeutics and vaccination strategies. Immunobiology. Epub 225(6), 152008.
- 8.Ruan Q, Yang K, Wang W, Jiang L, Song J. (2020) Clinical predictors of mortality due to COVID-19 based on an analysis of data of 150 patients from Wuhan, China. Intensive Care Med. 46(5), 846-848.
- 9.Du R H, Liang L R, Yang C Q, Wang W, Cao T Z et al. (2020) Predictors of Mortality for Patients with COVID-19 Pneumonia Caused by SARS-CoV-2: A Prospective Cohort Study. Eur Respir J. 56-3.
- 10.Tang N, Li D, Wang X, Sun Z. (2020) Abnormal coagulation parameters are associated with poor prognosis in patients with novel coronavirus pneumonia. J Thromb Haemost. 18(4), 844-847.
- 11.Tan L, Wang Q, Zhang D, Ding J, Huang Q et al. (2020) Lymphopenia predicts disease severity of COVID-19: a descriptive and predictive study. Signal Transduct Target Ther. 5, 33.
- 12.Zhao Y, Qin L, Zhang P, Li K, Liang L et al. (2020) . Longitudinal COVID-19 profiling associates IL-1RA and IL-10 with disease severity and RANTES with mild disease. JCI Insight 5(13), 139834.
- 13.Hussain A, Mahawar K, Xia Z, Yang W, El-Hasani S. (2020) . Obesity and mortality of COVID-19. Meta-analysis. Obes Res Clin Pract 14(4), 295-300.
- 14.Kermali M, Khalsa R K, Pillai K, Ismail Z, Harky A. (2020) The role of biomarkers in diagnosis of COVID-19—A systematic review. Life Sci. 254, 117788.
- 15.Wynants L, B Van Calster, Collins G S, Riley R D, Heinze G et al. (2020) Prediction models for diagnosis and prognosis of covid-19 infection: systematic review and critical appraisal. , BMJ 369, 1328.
- 16.Zhao Y, Qin L, Zhang P, Li K, Liang L et al. (2020) . Longitudinal COVID-19 profiling associates IL-1RA and IL-10 with disease severity and RANTES with mild disease. JCI Insight 5(13), 139834.
- 17.Xu Z. (2020) Pathological findings of COVID-19 associated with acute respiratory distress syndrome.Lancet Respir Med. 8(4), 420-422.
- 18. (2021) COVID-19 Clinical management: living guidance: pp. 19–21.WHO reference number:. WHO/2019- nCoV/clinical/2021. Accessed online https://www.who.int/publications/i/item/WHO-2019-nCoV-clinical-2021.1 .
- 19.Patridge E F, Bardyn T P. (2018) . , Research Electronic Data Capture (REDCap) J Med Libr Assoc 106(1), 142-144.
- 20.Levey A S, Stevens L A, Schmid C H, Zhang Y L, Castro AF 3rd et al. (2009) CKD-EPI (Chronic Kidney Disease Epidemiology Collaboration). A new equation to estimate glomerular filtration rate. , Ann Intern Med 150(9), 604-12.
- 21.Zhang Y H. (2013) Interferon-induced transmembrane protein-3 genetic variant rs12252-C is associated with severe influenza in Chinese individuals. , Nat Commun 4, 1418.
- 22.Zhang Y H. (2013) Interferon-induced transmembrane protein-3 genetic variant rs12252-C is associated with severe influenza in Chinese individuals. , Nat Commun 4, 1418.
- 23.Wilkinson T M. (2012) Preexisting influenza specific CD4+ T cells correlate with disease protection against influenza challenge in humans. Nat Med. 18(2), 274-280.
Cited by (1)
- 1.Awad Ramli Abubaker, Osman Hussien Mohammed, O Musa Abdualmoniem, Adel Shanawaz Mohammed, O Bakri Eman, et al, 2025, The Cytokine Profile in Sudanese Patients Infected with COVID-19 in Kassala State, Eastern Sudan, Jundishapur Journal of Microbiology, 17(12), 10.5812/jjm-157285