
Analysis of Risk of Death due to COVID-19 in Cameroon
Abstract
Background
Cameroon is battling against the novel coronavirus (COVID-19) pandemic. Although several control measures have been implemented, the epidemic continues to progress. This paper analyses the evolution of the pandemic in Cameroon and attempts to provide insight on the evolution of COVID-19 within the country’s population.
Methods
A susceptible-infected-recovered-dead (SIRD)-like model coupled with a discrete time-dependent Markov chain was applied to predict COVID-19 distribution and assess the risk of death. Two main assumptions were examined in a 10-state and 3-state Markov chain: i) a recovered person can get infected again; ii) the person will remain recovered. The COVID-19 data collected in Cameroon during the period of March 6 to July 30, 2020 were used in the analysis.
Results
COVID-19 epidemic showed several peaks. The reproductive number was 3.08 between May 18 and May 31; 2.75 between June 1 and June 25, and 2.84 between June 16 and June 24. The number of infected individuals ranged from 17632 to 26424 (June 1 to June 15), and 28100 to 36628 (June 16 to June 24). The month of January 2021 was estimated as the last epidemic peak. Under the assumption that a recovered person will get infected again with probability 0.15, 50000 iterations of the Markov chain (10 and 3- state) demonstrated that the death state was the most probable state. The estimated lethality rate was 0.44, 95%CI=0.10%-0.79%. Mean lethality rate assuming ii) was 0.10. Computation of transition probabilities from reported data revealed a significant increase in the number of active cases throughout July and August, 2020, with a mean lethality rate of 3% by September 2020.
Conclusion
Multiple approaches to data analysis is a fundamental step for managing and controlling COVID-19 in Cameroon. The rate of transmission of COVID-19 is growing fast because of insufficient implementation of public health measures. While the epidemic is spreading, assessment of major factors that contribute to COVID-19-associated mortality may provide the country’s public health system with strategies to reduce the burden of the disease. The model outputs present the threatening nature of the disease and its consequences. Considering the model outputs and taking concrete actions may enhance the implementation of current public health intervention strategies in Cameroon. Strict application of preventive measures, such as wearing masks and social distancing, could be reinforced before and after the opening of learning institutions (schools and universities) in the 2020/2021 calendar year and next.
Author Contributions
Copyright © 2022 Whegang Youdom, et al.
 This is an open-access article distributed under the terms of the Creative Commons Attribution License, which permits unrestricted use, distribution, and reproduction in any medium, provided the original author and source are credited.
Competing interests
The authors have declared that no competing interests exist.
Citation:
Background
As the novel coronavirus continues to race around the world at a frightening and ferocious pace, governments, organizations, and many research institutes are searching for ways to safeguard lives and effectively fight against the pandemic 1. It has been reported that about 20% of cases are severe infections, and mortality was estimated to be 3% in January 2020 2 but rose to 7.5% by July 2020 3. The latter estimate is higher than the WHO estimate of 4.2%, which leads to serious concern about the increase of cases and risk of death. Could we fill confident that the epidemic has ended? Is there a probability of the death number to increase? We propose to provide some answers through comprehensive modelling experiments.
Several methodological approaches have been applied to describe disease trends and identify priorities in public health interventions. Among these approaches, compartment models have been widely used during the early stage of the COVID-19 pandemic to attempt to understand its transmission dynamics 4, 5, 6.In such models, the entire population is divided into several subsets, namely: susceptible (S), exposed (E), infectious (I), recovered (R), and deaths (D) 7, 8, 9, 10. These model frameworks have the advantages of integrating a social distancing effect.
The contribution of deterministic models in the fight against COVID-19 pandemic has enabled the development of strategies to slow down the burden of the disease 5, 7, 8. On the other hand, stochastic approaches, such as Markov models, are a popular form of decision-analytic models as well. They characterize patient cohorts based on a finite number of mutually exclusive and exhaustive “health states”. Under the Markov property, classification of future health states depends only on the current health state, and not on the events that occurred before.Markov chain methods, which are widely used in many fields, including time series analysis and health systems to model the probability of events that occur in the future, given past and current observations 11, 12, 13. The Markov chain requires an initial probability and a transition matrix of probabilities to generate future states of a disease under multiple iterations 14, 15. The transition probability provides the extent for the studied unit to move from one state to another, as well as the probability of remaining in the same state. In terms of disease, the model determines the likelihood of a patient moving from one health state to another over a discrete time 16. The correct implementation of Markov models requires a reliable and robust estimation of transition probability matrices (TPMs). Markov models have been deployed to understand the behaviour of numerous diseases including COVID19 12, 13, 14, 15, estimate/predict mortality rate among the vulnerable populations 17 and estimate the actual number of persons in each COVID-19 18.
Several parameters are necessary to build the transition probability of the burden of COVID-19 and its trends: the probability of an active case to recover, the probability that an active case dies, and the probability that a recovered person remains cured or gets re-infected. An active case is defined as a COVID-19-infected individual who can be with or without mild or moderate symptoms, or in a severe or critical condition. On the other hand, there is a probability of re-infection after recovering 19. Some articles claimed that recovered COVID-19 patients can get the infection again once antibodies start depleting 20, 21. It has been reported that a proportion of recovered patients after covid-19 infection were re-infected 22. In addition, according to a recent meta-analysis, SARS-CoV-2 recurrent RNA positivity in recovered COVID-19 patients ranged between 7-23% across the studies, with follow-up testing between 1-60 days 23.
In this study, we present the current trend of COVID-19 in Cameroon and estimate the number of infected Cameroonian individuals using a differential equation model (a susceptible-infected-recovered-dead (SIRD) model) based on cumulative confirmed cases. The evolution of the disease (susceptibility, infection, recovery, death) was first modelled using a ten-state Markov chain, followed by a three-state Markov chain. The risk of death was estimated by a simulated Markov chain from transition probability-based modelling. The aim of the present study was to model the epidemic curve and promote preventive measures against COVID-19.
Materials and Methods
Current Statistics and Epidemiological Data
Daily records of the COVID-19 cases were obtained from a public repository (https://www.worldometers.info/coronavirus/country cameroon/). The data included information dating from March 6, 2020, when the first COVID-19 cases were confirmed in Cameroon. The data revealed that the country has successively experienced 3 epidemic peaks (Figure 1): on April 3 (203 positive cases), on May 22 (555 cases), and on June 15 (1183 cases). The high peak observed on June 15, 2020 resulted from a large screening campaign conducted by the government. On June 24, the total number of confirmed cases was 12592, among whom 10100, 313, and 2179 were individuals who recovered, those who died, and active cases, respectively. From June 25 to July 6, the total active cases remained constant as the country did not provide record of new COVID-19 cases.
By July 30, the total number of cases reported were 17255, among whom 391, 15320, and 1544 died, recovered, or remained active cases, respectively, bringing the cure rate to 88.8% and a lethality rate to 2.3%. However, the number of cases started increasing from July 7 to 30, with regular increase of confirmed cases, suggesting the continuity of the epidemic. Data showed a constant increase of confirmed cases with a short period of under-reporting of cases. Under-reporting was noted during the month of July. A slight increase in the number of deaths was observed in July 19 (Figure 1). The epidemic in Cameroon revealed 3 peaks and more peaks are expected due to difficulties in maintaining confinement measures and re-opening of learning institutions.
Figure 1.Coronavirus trend in Cameroon from March 6 to July 30, 2020. Number of persons reported = confirmed cases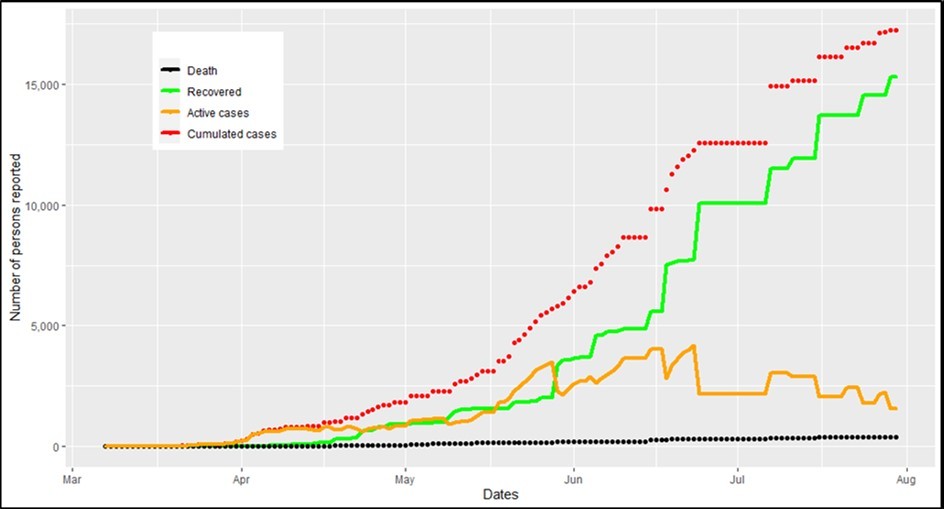
Active cases can be either symptomatic with mild, severe, or critical disease condition, or asymptomatic. Cabore et al. estimated the risk of exposure (RoE) in Cameroon at 0.461 18, considering it as the risk of getting infected at time t, time t being considered as a reported date. This estimation was derived from a function of gathering events, sanitation and hygiene practices, weather, and distribution, i.e. movement of an infected individual.
Modelling Approaches
Two approaches were adopted: a SIRD model, and a discrete-time Markov chain with different transition probabilities.
The first modelling experiment used the data from May 18 to May 31 (two weeks before the end of lockdown) to project the epidemic trend in June, July and August. The second modelling experiment used the data from June 1 to June 24 to project the trend of the pandemic in July and August 2020. The risk of an increased number of deaths was assessed using data from March 6 to June 24, 2020. Some modelling experiments like the transition probabilities were calculated on aggregated data over time (from March 6 to July 30, 2020) since individual data were not available and were used to estimate the total number of infected persons during the month of July 2020.
SIRD Model
The SIRD model was used, first, to examine the evolution of the epidemic during the last two weeks in May (throughout the period of May 18 to June 24), and, secondly, during the whole month of June after the first re-opening of learning institutions to end the 2019/2020 academic year, with the purpose of assessing the impact of learners on the epidemic trends, and to predict the trend of the epidemic in Cameroon 10, 18.
Details regarding the model are found in the appendices, equation A.1, as well the calculation of R0 24. The model assumed a social distancing effect α, which was assessed during the studied period 18. Social distancing effect of 1 implies a complete confinement, but an inverse effect can also be expected since gathering events are still allowed and learning institutions were re-opened during the period of data analysis.
Markov Chain Transition Matrix
Given a day and an infected individual, there are different intra-individual status and circumstances of disease transmission. An infected individual can become a closed case (i.e., death), or recovered/discharged, or remain an active case (who is not yet completely recovered and not dead). An active case can have either mild symptoms or serious/critical condition that could either lead to death or recovery. We assumed that a recovered individual could get infected again if re-exposed to the virus.
We were interested in estimating the transition probability among different possible states and the probability of death given the other conditions. The state of death was regarded as an absorbent state since an individual cannot leave that state once he or she is classified as dead. Active case and recovered states were assumed to be transient as individuals can leave these states and return to them after some time. These multiple states occur as a random process usually known as a stochastic process.
We applied a Markov chain with multiple states (3 and 10) to estimate the probability of the death state to occur, and the probability of death number to increase. It is known that Markov chain property states that, the probability of an event to occur in the future, given the past and the present conditions, depends only on the present condition 25. Long-term simulation of a Markov chain allows to reach the stationary distribution, where no more variation is found in the time series It usually relies on discarding the first half of simulation (called burn-in process), and probability estimates are based on the last iterations.
Notations
In this paper, 1 denotes the active case, 2 the recovery state, and 3 the death state. It was assumed that a recovered individual is still at risk of being re-infected. Therefore, possible transitions are represented by the following sequences: 1 1, 1 2, 1 3, 2 1. Discrete Markov chain models assume that the current state of observation fully depends on the state of the observations at the previous time step per discrete time interval. Mathematically, this means that the probability to observe state i at time t transitioning to state j at time t + 1, or the t-step forward transition probability along the course of observations, is denoted by: pi, j (t) = Pr [I(t + 1) = j|I(t) = i], where Pr denotes the probability, and I(t) is the identification of observed state at time t. The single time-step transition probability is defined as pi, j (1), and is also referred to as the daily transition probability. The sum p11+p12+p13 is the total percentage of state of infection on day t of an individual who remained in one of the three states at time t+1. This sum is always equal to 100%, or 1.
Assumptions
There is evidence to suggest that, among symptomatic cases, the probability of having mild, moderate, severe, or critical disease is approximately 40%, 40%, 15% and 5%, respectively (Epidemiology group, Park M). Hospitalisation rates vary depending on hospitalisation policy and capacity in a given region or country, but it is estimated that 30% of symptomatic patients need hospitalisation, with the highest case fatality rate (CFR) in critical cases (up to 89% without intervention) and 49% for severely ill patients 26, 27.
Ten-States Disease Modelling
Cabore et al. described a ten-stage disease modelling that encompasses all states for a COVID-19 case with the description of no point-in-time and time dependence, as follows: a country’s population is deemed susceptible (S1 , the initial Markov state), while the exposed population (those at risk of getting infected at any given time) are the next Markov state, S2. Individuals who get infected are the next state (S3). If they are not infected (including recovered individuals), they will return to the previous Markov state (S2) to face a continued risk of exposure. An infected individual can be represented by five mutually exclusive Markov states: asymptomatic (S4), mild symptoms (S5), moderate symptoms (S6), severe symptoms (S7) or critical symptoms (S8). ‘Absorbent states’ are death (S9) or recovery (S10).
Three States-Disease Modelling
Since an infected person can be classified into one of the enumerated disease conditions with probability 0.8, 0.08, 0.08, 0.03, 0.01, for asymptomatic, mild, moderate, severe, and critical states, respectively 18, the probability of being an active case and remaining active varies from 0.01 to 0.8. For the transition matrix, p11 is set to 0.2 (the mean of those values). The probability of recovery also varies depending on the state of the disease (Figure 4). It decreases when the disease state becomes worse. It is equal to 1 for mild, asymptomatic, or moderate cases, and 0.5 for severe condition, and 0.12 for critical state, respectively. An active case can recover with a probability of p12=0.72, i.e. the mean of the transition probabilities of moving from infection status to recovered stage. Death usually occurs in severe and critical states with a higher probability among severe cases, with p13 = 0.69 (i.e., the mean of 0.5 and 0.88). Since the sum of the rows of the transition matrix should be equal to 1, the probability of being infected and died was derived from the probability of being infected and remained infected (0.2), and the probability of moving from infection to recovering (0.72) i.e. 1-0.2-0.72=0.076.
The estimate of RoE in Cameroon accounted for several factors, such as the sanitation and hygiene practice, gathering events, re-opening of learning institution, and other factors of vulnerabilities (Cabore et al., 2020). Since a recovered individual can get re-infected with probability that ranged from 7 to 23%22, and could reach 14% (a country report accessible at https://www.todayonline.com/world/14-patients-who-recovered-covid-19-test-positive-again-guangdong-report), it was assumed that a recovered individual will be re-infected with probability 0.15 (that is the mean value of the range 7 to 23%). Given this consideration, an individual will remain recovered with a probability p22 of 0.85 (i.e., 1 – 0.15). In the other hand, for the purpose of comparison, it was also assumed that a recovered person will remain recovered.
The Markov chain and the probabilities of all transition states are illustrated in Figure 2 (A and B). We used each transition matrix to simulate the probability of being in each state over 91 days (which cover the month of July and August 2020). In addition, p13 was also calculated from time-series data of infected/recovered/death persons.
Figure 2.Transition probabilities among COVID-19 states.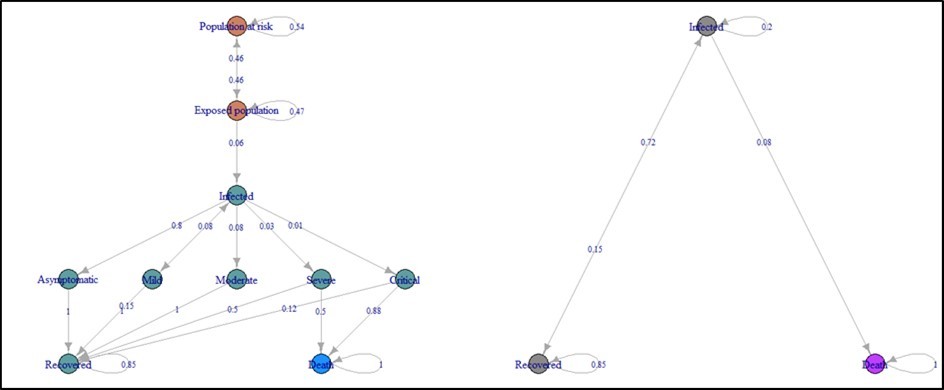
On the left:10-state disease with one absorbent state (death), with the assumption that a recovered person can get infected again. On the right: three-state transitioning probabilities built from the 10-states. This figure was built using the R package markovchain. Transition probabilities on the left were extracted from a published study 18, 22. In the right, the probability of being infected and died was derived from the probability of being infected and remained infected (0.2), and the probability of being infected and recovered (0.72) i.e. 1-0.2-0.72.
Modelling the Number of Active Cases/Death/Recovered
To assess whether the epidemic curve will continue to increase, we studied the number of active cases/recovered/death from March 6 to June 24. The trend was viewed as a time series, and each section of the data was classified into 3 categories: “increase”, “drop”, or “constant” over time, starting from March 6 to June 24. The decomposition yielded a sequence of three states from which a first order Markov chain was fitted to obtain a transition probability between increase, drop and constant states 28, 29. We analysed the probability of having an increase in the number of active cases/recovered/death by August 2020 by running 92 iterations of the Markov chain starting from June 24.
Modelling the Transition Probability from March 6 to July 30, 2020
A 3-state Markov model was applied on the data during the period starting from March 6 to July 30, 2020to study the evolution of the disease, to assess the impact of control measures recommended by the Cameroonian government, and to estimate the total number of cases of COVID-19 in Cameroon. Yang Liu (2020) provided a comprehensive set of formula to derive the transition probabilities for COVID-19 using a 3-state Markov chain such that, as time t increases, the probability to attain the absorbent death state will converge to the true case fatality rate (CFR), as CFR naïve estimates being restricted to resolved cases 30. For each day, daily transition probabilities for the 3-states denoted pi, j were calculated. These empirical probabilities were then used to forecast over several iterations (91 iterations starting from June 24, including July, August and September 2020), the total number of COVID-19 cases 31.
Given the assumptions and statistical data, we used several innovative methods embedded in the R Epidemics Consortium (RECON) suite tools in R (https://www.repidemicsconsortium.org/), and the markovchain package, to analyse the data. In addition, Markov chain simulations were based on 50000 iteration among which the first 25000 were discarded to allow for convergence. The software R (version 3.6.3) was used to implement the models 32.
Results
SIRD Model
Two weeks before learning institutions re-opened, i.e. from May 18 to May 31, 2020 (a time period characterized by the relaxation of measures initially imposed by the government to the population at the onset of the pandemic in Cameroon), the SIRD model estimated a basic reproduction number R0 of 3.08, and a social distancing effect of 0.50.
Before the peak of the epidemic that occurred on June 15, R0 was estimated as 2.75, with α = 0.479, implying a small decrease compared to two weeks later. This decrease could be due to the total number of reported infected cases that remained constant for more than four days. The estimated number of infected individuals ranged from 17632 to 26424 (median=21587) persons.
From June 16 to June 24, the model estimated R0 as 2.84 (α=0.45), which yielded the number of infected individuals ranging from 28100 to 36628, suggesting the continuity of the disease severity. Projection of COVID-19 cases revealed an increase rate throughout the month of August (Figure 3).
There was an absence of reporting between June 25 and July 6, 2020. The projected cases (June 1 to July 30) was made by adding the total observed cases between June 25 and July 30, to June1-June 24 data. The model projected an increase in the number of death by mid-August 2020. The dotted dark-green curve and the orange dashed line provide the interval of the epidemic evolution in Cameroon by Mid-August 2020.
A long-term projection based on the data from May 1 to June 24, 2020 shows an exponential epidemic trend by mid-August 2020 (Figure 3). In addition, we assessed the time when the last epidemic peak will be reached by carrying out a long-term simulation with the SIRD model. It appeared that the total number of infected cases displayed a downward trend by January 2021, especially in the context of the implementation of strict measures such as social distancing (Figure 4).
Figure 4A shows the epidemic trend from May 1 to June 24, 2020 using reported cases. Projection in Figure 4B is based on the whole data from May 1 to June 24, and Figure 4C is based on the projection that used data from June 1 to June 24.
Figure 3.Numbers of cases and deaths observed between June 1 and June 24, 2020, and projection of the epidemic trend in Cameroon by mid-August 2020.
Figure 4.The estimated time of epidemic peak according to the number of infected individuals reported
The consequence of this increase in the number of infected individuals could inevitably lead to an increase in the number of deaths. The projection during the month of May and June showed that the mortality rate associated with Covid-19 was increasing rapidly (Figure 3). This observation suggests that modelling the risk of death can contribute to provide to decision makers, some insights of the disease progression.
Markov Chain Approach
Assessing the Risk of Death Using a Ten-States Markov Chain Model
Using a homogeneous Markov chain with ten-state disease (Figure 2), we assessed future occurring states by simulating one chain of 50000 elements with 4 different initial states (infected, exposed, asymptomatic, mild, moderate) under the hypothesis that a recovered person can get infected again. The results are presented in Figure 5. When the initial states were successively changed into moderate, mild, infected, and exposed, the death state was the most likely one. Given an asymptomatic state at the initial stage, the person will remain most of the time exposed in an infected environment or remained in the death state. When the first 25000 iterations were discarded, the remaining 25000 elements were only the death states.
Figure 5.Assessment of the future occurring state using the ten-state Markov chain.
Assessment of the future occurring state using the ten-state Markov chain 50000 iterations of a chain was ran and the probability of attaining each state was calculated using different initial states (asymptomatic, exposed, infected, mild, and moderate); all except asymptomatic condition constantly led to death state as the most likely.
Assessing the Risk of Death Using a Three-States Markov Chain Model
Given the assumption that a recovered person can be re-infected, the transition matrix on Figure 2 was used to calculate new transition probabilities over 91 days (including July, August and September 2020), assuming that the matrix in Figure 2 is the transition probability on June 24 i.e. p11=0.2, p12=0.72, p13=0.08 , p21=0.15, and p22=0.85. Figure 6 shows how varied the probability of being in one of the three states, given an infected individual in June 24. It also showed an increase in the probability of an infected individual to dwell in the death state, while the probability of remaining infected decreased, as well as the probability of being recovered. Based on these simulations, estimates of the lethality rate yielded a range values of 7.6% to 69%, with mean of 44% and 95% confidence interval (CI) of 10%-79%. If a recovered person will remain in the same state, the lethality remained constant over July, August and September, and was 10% (Figure B2 in the annexes).
Figure 6.Assessment of the probability in the increase of the number of deaths using a three-state Markov chain.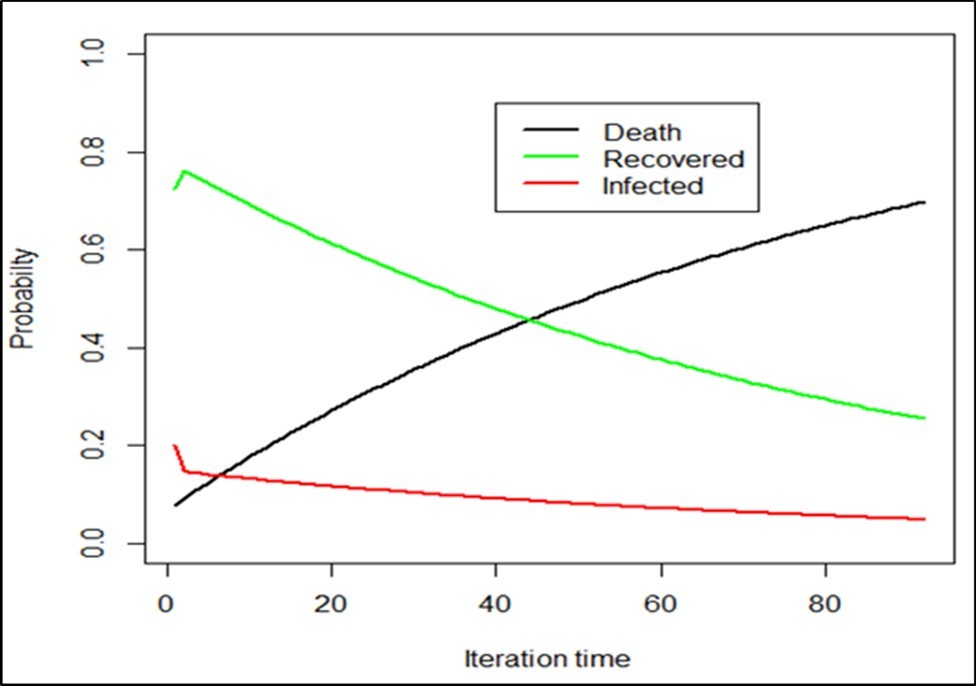
Figure B2.Estimate of the lethality rate using a three-stage Markov chain with probabilities p11=0.2, p12=0.72, p13=0.08, assuming a recovered individual will remain recovered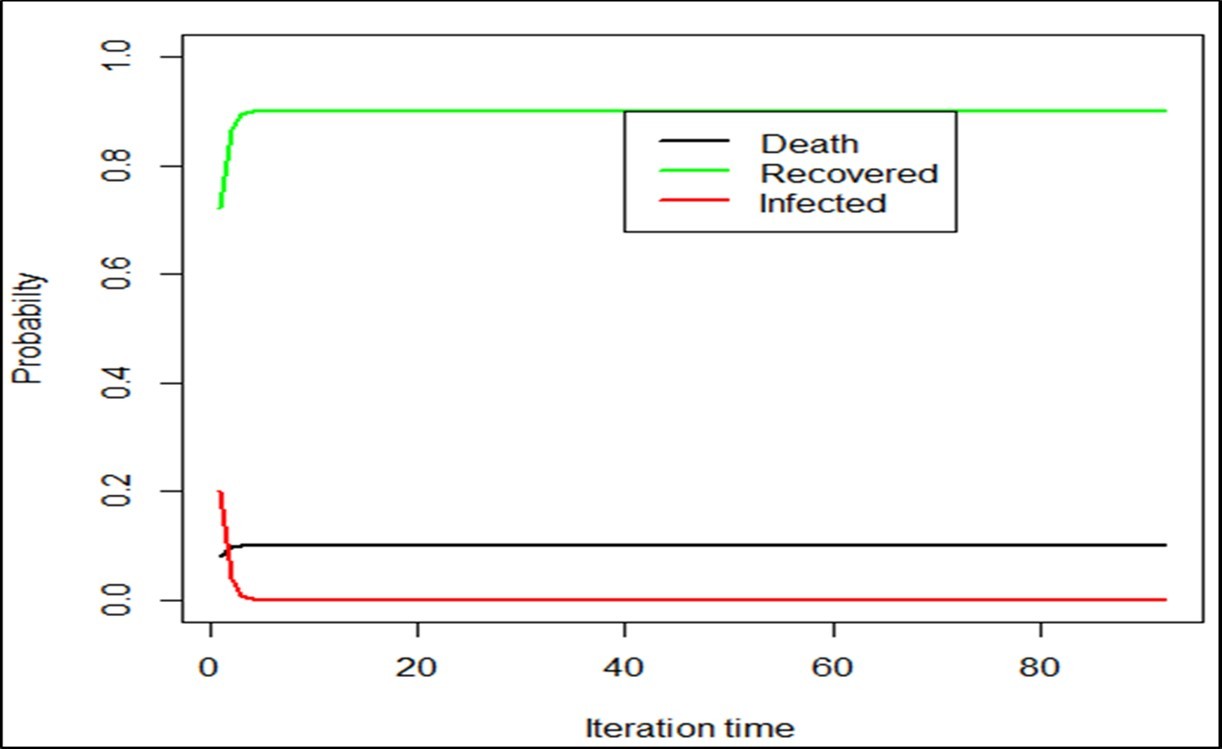
On the other hand, assuming that a recovered person will remain uninfected (which is in agreement with the country data on June 24), i.e. p11=0.0896, p12=0.8878, and p13= 0.0226, after a run of 50000 iterations and 25000 first iterations discarded, the recovered state was the most probable outcome. Estimates of the lethality rate yielded 2.4% with a 95% confidence interval (CI) of 2.45-2.53.
The transition probabilities p11=0.2, p12=0.72, p13=0.08, p21=0.15, and p22=0.85 defined in Figure 2 were used to assess the changes in the stages of infected, recovered and death over the months of July, August and September 2020.
What is the Probability of Having an Increased Number of Deaths?
After discretizing each reported time series data (from March 6 to June 24) into several sub-time series data showing either a decrease, an increase, or constant values, we looked at the probability of having an increased number of active cases, recovered cases, and deaths over the months of July, August and September 2020. Indeed, for each COVID-19 data (active case, recovered or death), a 3 - dimensional discrete Markov Chain was built using the sequence generated by the following states: “constant”, “drop”, and “increase. For each sequence, we were interested in the increasing probability. The simulation carried out over 92 days starting from June 24 revealed an increase in the number of deaths throughout August and September (Figure 7). In addition, the probability of the number of deaths to increase converged to 0.42 by September 2020.
Figure 7.Estimates of the probability of an increased number of COVID-19 reported indicators.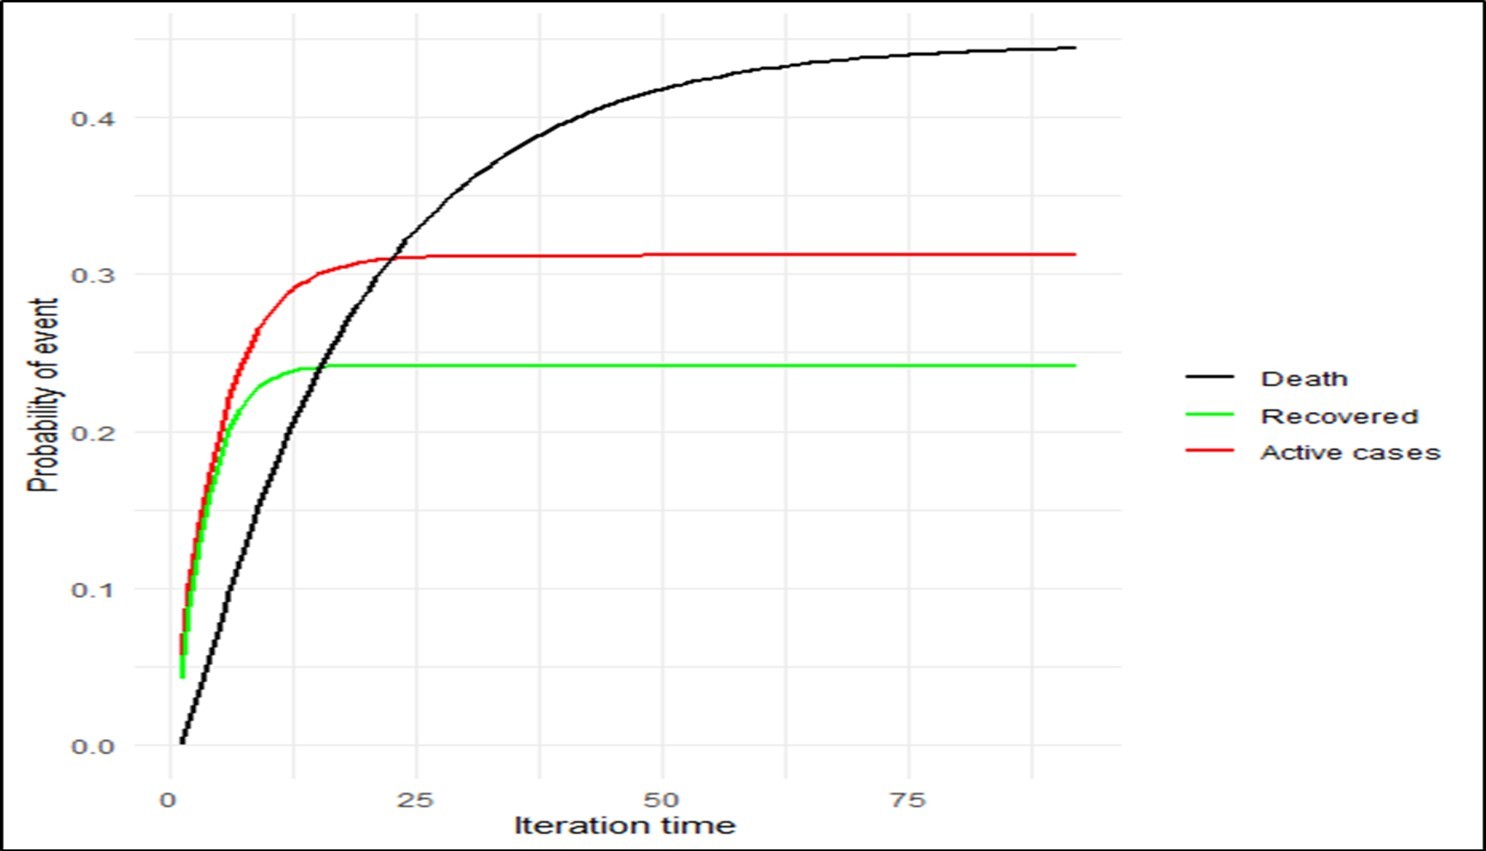
Estimated Total Cases from July 1 to July 30 Using Transition Probabilities
The computed transition probabilities from March 6 to July 30, 2020 yielded a mean of p11=0.33, p12=0.65, and p13=0.02. These transition probabilities are graphically shown in appendix B (Figure B1). We used these transition probabilities to forecast the total COVID-19 cases between July 1 and July 30. According to the projection, the epidemic worsens and increases the number of infected individuals significantly during the period between July 1 and July 30, suggesting constant activity of the COVID-19 virus in Cameroon (Figure 8).
Figure 8.Total COVID-19 cases estimated using transition probabilities during the month of July.
Figure B1.Evolution of the transition probabilities from March 6 to July 30, 2020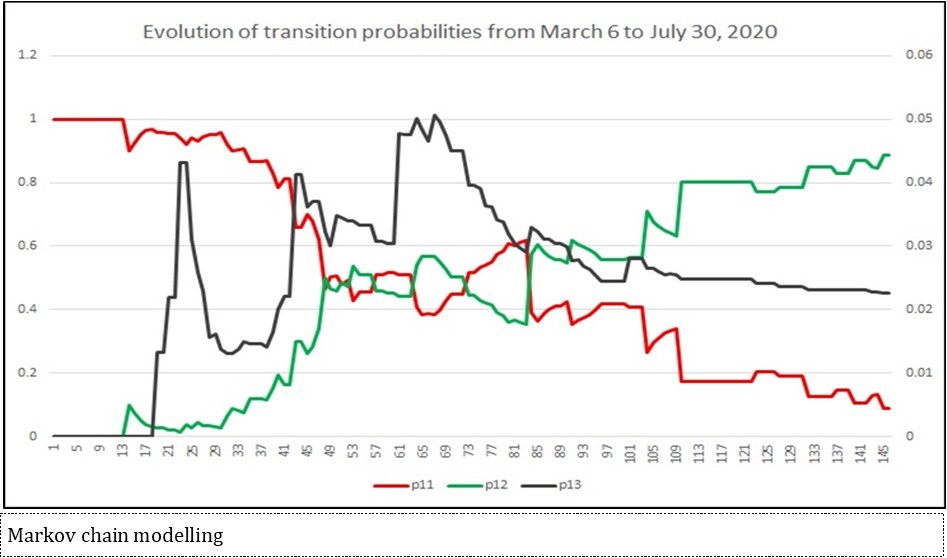
Legend: the transition probabilities were computed from the time series of reported COVID-19 cases. The projected number of total cases was significantly higher than the observed total cases. It was expected more than 24000 cases by July 30, 2020.
Discussion
This study used several comprehensive analytical options to model the trend of COVID-19 epidemic in Cameroon. The analysis was first performed using the compartment model to predict COVID-19 morbidity, followed by the application of Markov chain transition probabilities with different assumptions.
The basic reproductive number obtained by the first method was significantly greater than 2.37 as reported by Musa SS et al. 33, suggesting a high level of disease transmission among individuals within the population, and the continue increasing character of the epidemic. Although daily incidence data were very sparse because of gaps in the reporting sequences, we demonstrated that different initial states of COVID-19 can led to the death state as the most likely, suggesting potential increase in the number of deaths. This model presumed that the increase could be attributed to symptomatic persons who will probably not receiving treatment care on time, and become either severe, or critical cases. Indeed, due to the exponential increase in the number of cases by July 30, 2020 severe and critical cases could increase and vary from 7781 to 35000 cases during the months of July and August 2020 18, 34. In addition, because of the high risk of transmission in the community in remote regions, some undiagnosed cases may lead to a fatal state. On the other hand, infected individuals who die due to COVID-19 infection may be considered to belong to the category of ‘vulnerable’ population with underlying concomitant chronic illness, such as diabetes, hypertension, and cardiovascular and pulmonary diseases. Indeed, it has been established that these patients are 12 times likely to die of COVID-19 than healthy people 35. As of December 2021, the total deaths had increased up to 1600 cases, and now around 2000 cases as of March 2022 (http://www.worldometers.info/coronavirus/country/cameroon).
Increase in the mortality rate associated with COVID-19 epidemic raises questions on several aspects related to the main causes of death due to COVID-19. It is known that old age, males, and the presence of chronic comorbidities are associated with more severe disease and higher mortality 36, 37, 38, 39. However, these studies lacked details on age and sex distribution or on the extent and nature of the co-morbidities 40, 41, 42. While a high number of young individuals (less than 20 years old) in Africa have been infected, total number of deaths disaggregated by age increased with R0 and reached up to 300000 cases among person ≥ 65 years when the basic reproductive number reaches up to 2.9 43. COVID-19 induced death in Cameroon should be monitored and assessed for possible association between age and vulnerability 44, 45. In addition, as the infection rate increases, the assessment of correlation between COVID-19 associated death and HIV infection or vulnerable individuals could help and guide the diagnostic testing process by targeting people with high risk of death 45, 47. It has indeed been found that HIV-positive individuals 46 and individuals with diabetes and cardiovascular diseases 47 are exposed to a risk of mortality due to COVID-19 that is twice as high as those of the general population 48. The estimated mortality rate was 1.1% in non-severe patients and 32.5% in severe cases during the average of 32 days of follow-up 49.
This analysis implicitly showed that, severe COVID-19 cases may still be present and had been partially quantified using mass screening tests during the month of July. Despite that fact, the number of active cases remained constant during almost 2 weeks, from June 25 to July 6.
Studies to ascertain the number of COVID-19 cases being identified suggest the SARS-CoV-2 ascertainment rate of 2.22–35.58%, indicating that many non-severe cases are not included in reported cases 50, thus rendering the number of asymptomatic cases unknown. Indeed, asymptomatic cases can only be determined from seroprevalence and epidemiological tests to find the actual numbers of infected persons. In the same vein, a one-year prediction of the implications arising from a widespread community transmission of SARS-CoV-2 in Cameroon revealed that over 8 million (8650261 million) individuals are at risk of contracting the disease 18.
The data analysed in the present study lacked individual demographic and patient clinical data. Indeed, modelling experiments presented here did not include some vital factors such as the youthfulness of the population, immunomodulation related to permanent contact with certain infectious agents and/or vaccines, cross-reactive immunity between SARS-CoV-2 and other strains of coronaviruses, the widespread use of antimalarial drugs, zinc, vitamin C, and other complementary therapies that may be responsible of actual reduce infections and mortality in Cameroon and many African countries if compared to other countries in Europe and United State of America.
Future models should account for the number of hospitalized patients under treatment and information on how they evolve from one disease stage to another during hospitalization for the purpose of evaluating the benefit of the treatment.
Strict implementation of self-protection and possible protective measures such as wearing a mask and staying indoor to reduce the risk of getting infected, should continue to be applied by the population to avoid future outbreaks. In addition, the public should not relax their vigilance against the transmission of this highly contagious disease.
Conclusions
The number of COVID-19 infected individuals is increasing rapidly in Cameroon because of the negligence in the implementation of public health measures and non-pharmaceutical strategies, as well as lack of clinical trials to evaluate the best treatment. It is premature to anticipate an end to the outbreak especially in the capital city of Cameroon, Yaoundé, which is currently considered as the epicentre of the disease in the country. The present analysis provided some insights into the potentially dangerous nature of the disease and its consequences, to strengthen decision making.
Appendices
The SIRD model
The differential equations of the SIRD model are given as 18, 19:
dS/dt=-ρ*β*I*S/N
dI/dt=ρ*β*I*S/N -γ*(1-μ) *I -μ*I A.1
dR/dt=γ*(1-μ) *I
dD/dt=μ*I
The model has four parameters: the transmission rate or the growth rate, β which controls the transition between S and I; the recovery rate γ for hospitalized patients, and the death rate μ. We incorporated social distancing through a constant rate ρ which falls in the interval 0-1, that is expected to decrease the force of infection. We expected that ρ will tend to 1, but we acknowledged the fact that perfect social distancing is difficult to achieve as it directly linked to human behaviour.
In most exponential models the value of R0 is estimated by the expression β/γ+μ 18, 19. This quantity was used to fit the numbers of infected individuals in each compartment of the SIRD model by the end of each epidemic phase.
Author Contributions
SWY developed the analysis plan, performed the analyses, and drafted the article under the closed supervision of HT. The two authors performed the work for UNITED#COVID-19, the task force of the University of Dschang (Cameroon) for the fight against the novel coronavirus.
Funding
This research did not receive any specific grant from funding agencies in the public, commercial, or not-for-profit sectors.
References
- 1. (2019) Centers for Disease Control and Prevention C. Novel Coronavirus (2019-nCoV). , Wuhan,China.https://www.cdc.gov/coronavirus/2019-ncov/
- 2.Wang C, Horby P W, Hayden F G, Gao G F. (2020) A novel coronavirus outbreak of global health concern. Lancet.
- 3.Wang Z, Yang B, Li Q, Wen L, Zhang R.. Clinical Features of 69 Cases with Coronavirus Disease 2019 in Wuhan, China. Clin Infect Dis 71(15), 769-777.
- 4.Wu J T, Leung K, Leung G M. (2020) Nowcasting and forecasting the potential domestic and international spread of the 2019-nCoV outbreak originating in Wuhan, China: a modelling study.Lancet. 395(10225), 689-697.
- 5.Li Q, Guan X, Wu P. (2020) Early transmission dynamics in. , Wuhan, China, of, N Engl J Med 382, 1199-1207.
- 6.Zhao Shilei, Chen Hua.Modelling the epidemic dynamics and control of COVID-19 outbreak in China. Quantitative Biology.
- 7.Wang H, Wang Z, Dong Y. (2020) . Phase-adjusted estimation of the number of Coronavirus Disease 2019 cases in Wuhan, China.Cell Discov 6, 10.
- 8.Zhao S, Chen H. (2020) Modelling the epidemic dynamics and control of COVID-19 outbreak in China. Quant Biol.1-9
- 9.Anastassopoulou C, Russo L, Tsakris A, Siettos C. (2020) Data-based analysis, modelling and forecasting of the COVID-19 outbreak.PLoS One. 15(3), 0230405.
- 10.Fanelli D, Piazza F. (2020) Analysis and forecast of COVID-19 spreading in China, Italy and France.Chaos Solitons Fractals. 134, 109761.
- 11.Schweiger R, Erlich Y, Carmi S. (2019) FactorialHMM: fast and exact inference in factorial hidden Markov models. , Bioinformatics 35(12), 2162-2164.
- 12.Tada T, Toyoda H, Yasuda S. (2019) Natural history of liver-related disease in patients with chronic hepatitis C virus infection: An analysis using a Markov chain model. , J Med Virol 91(10), 1837-1844.
- 13.Siddle K J, Eromon P, Barnes K G. (2018) Genomic Analysis of Lassa Virus during an Increase. in Cases in Nigeria inN Engl J Med 379(18), 1745-1753.
- 14.Welton N J, Ades A E. (2005) Estimation of Markov chain transition probabilities and rates from fully and partially observed data: uncertainty propagation, evidence synthesis, and model calibration. Med Decis Making. 25(6), 633-645.
- 15.Cabras S. (2018) A Markov chain representation of the multiple testing problem. , Stat Methods Med Res 27(2), 364-383.
- 16.Gutierrez-Alcaraz G, Sheble G B. (2004) Electricity market price dynamics: Markov process analysis. International Conference on Probabilistic Methods Applied to Power Systems 14-19.
- 17.Ruiz-Patiño A, Arrieta O, Pino L E, Rolfo C, Ricaurte L et al. (2020) Mortality and Advanced Support Requirement for Patients with Cancer With COVID-19: A Mathematical Dynamic Model for Latin America.JCO Glob Oncol. 6, 752-760.
- 18.Cabore J W, Karamagi H C, Kipruto H. (2020) The potential effects of widespread community transmission of SARS-CoV-2 infection in the World Health Organization African Region: a predictive model. BMJ Glob Health. 5(5), 002647.
- 19.NE Nkiru Edith Obande-Ogbuinya, Omaka-Amari L N, Nwafor Jude N, Omeje Chinenye B, Chito Orji ML et al. (2020) Review of COVID-19 Re-Infection among Recovered Patients and Its Implication for Lung Health.Global. , Journal of Health Science.12(12)
- 20.Chaturvedi R, Naidu R, Sheth S, Chakravarthy K. (2020) . Efficacy of Serology Testing in Predicting Reinfection in Patients With SARS-CoV-2.Disaster Med Public Health Prep.1-3 .
- 21.Self W H, Tenforde M W, Stubblefield W B, Feldstein L R, Steingrub J S et al. (2020) Decline in SARS-CoV-2 Antibodies After Mild Infection Among Frontline Health Care Personnel in a Multistate Hospital Network - 12 States, April-August. , MMWR Morb Mortal Wkly Rep 69(47), 1762-1766.
- 22.Mattiuzzi C, Henry B M, Sanchis-Gomar F, Lippi G. (2020) SARS-CoV-2 recurrent RNA positivity after recovering from coronavirus disease 2019 (COVID-19): a meta-analysis.Acta Biomed. 91(3), 2020014.
- 23.Nachmias V, Fusman R, Mann S, Koren G. (2020) The first case of documented Covid-19 reinfection in Israel. , IDCases 22, 00970.
- 24.Ma Junling. (2020) Estimating epidemic exponential growth rate and basic reproduction number.Infectious disease modelling5. 129-141.
- 26. (2020) Epidemiology Group of the New Coronavirus Pneumonia Emergency Response Mechanism of the Chinese Centers for Disease Control and Prevention. Epidemiological characteristics of new coronavirus pneumonia.Chinese. , Journal of Epidemiology 41, 113-22.
- 27.Park M, Cook A R, Lim J T. (2020) A systematic review of COVID-19 epidemiology based on current evidence.J Clin Med. 9, 967.
- 29.Nurul Nnadiah Zakaria, Othman Mahmod. (2019) Rajalingam Sokkalingam, Hanita Daud, Lazim Abdullah, Evizal Abdul Kadir. Markov chain model for forecasting air pollution index of Miri. , Sarawak. Sustainability 11, 5190.
- 31.Gong Wei Chen.Simultaneous Forecasts of Multiple Interrelated Time Series with Markov Chain model. SAS support paper, accessed athttps://support.sas.com/resources/papers/proceedings16/2060-2016.pdf
- 32. (2020) R Core Team. A language and environment for statistical computing. R Foundation for Statistical Computing. , Vienna, Austria. URLhttps://www. R-project.org/
- 33.Musa S S, Zhao S, Wang M H, Habib A G, Mustapha U T et al. (2020) Estimation of exponential growth rate and basic reproduction number of the coronavirus disease2019 (COVID-19) in Africa. Infect Dis Poverty. 9(1), 96.
- 34.Frost Isabel, Osena Gilbert, Craig Jessica, Hauck Stephanie. (2020) . COVID-19 in Middle Africa: National Projections of Exposed, Contagious, Symptomatic & Severe Cases. Centre for Disease Dynamics, Economics & Policy .
- 36.Wu Z, McGoogan J M. (2020) Characteristics of and Important Lessons from the Coronavirus Disease2019 (COVID-19) Outbreak in China: Summary of a Report. of 72 314 Cases from the Chinese Centre for Disease Control and Prevention. JAMA - J Am Med Assoc.323: 1239-42.
- 37.Grasselli G, Zangrillo A, Zanella A. (2020) Baseline characteristics and outcomes of 1591 patients infected with SARS-. CoV-2 admitted to ICUs of the Lombardy region, Italy.JAMA.323 : 1574.
- 38.Liu W, Tao Z- W, Wang L. (2020) Analysis of factors associated with disease outcomes in hospitalized patients with 2019 novel coronavirus disease.Chin Med J.133:. 1032-8.
- 39.Du R- H, Liang L- R, Yang C- Q. (2020) Predictors of mortality for patients with COVID-19 pneumonia caused by SARS- CoV-2: a prospective cohort study.Eur Respir. J.55: 1-3.
- 40.Rao C. (2019) Elements of a strategic approach for strengthening national mortality statistics programmes. , BMJ Glob Health 4(5), 001810.
- 41.Rao C. (2020) Medical certification of cause of death for COVID-19. Bull World Health Organ. 98(5), 298-298.
- 42.Rao C, Lopez A D, Hemed Y.Causes of Death. In:. (2006).Disease and Mortality in Sub-Saharan Africa. 2nd ed. Washington (DC): The International Bank for Reconstruction and Development / Jamison DT, Feachem RG, Makgoba MW, et al .
- 43.Wells C R, Stearns J K, Lutumba P, Galvani A P. (2020) . COVID-19 on the African continent. Lancet Infect Dis.1473-3099(20): 30374-1.
- 44.Verity R, Okell L C, Dorigatti I. (2020) Estimates of the severity of coronavirus disease 2019: a model-based analysis [published correction appears in Lancet Infect Dis. 20(6), 669-677.
- 45.Li X, Xu S, Yu M. (2020) Risk factors for severity and mortality in adult COVID-19 inpatients in Wuhan. , J Allergy Clin Immunol 146(1), 110-118.
- 46.Davies M A. (2020) HIV and risk of COVID-19 death: a population cohort study from the Western Cape Province, South Africa. Preprint. medRxiv
- 47.Rastad H, Karim H, Ejtahed H S. (2020) Risk and predictors of in-hospital mortality from COVID-19 in patients with diabetes and cardiovascular disease. , Diabetol Metab Syndr 12, 57.
- 48.Wang Z, Yang B, Li Q, Wen L, Zhang R. (2020) . Clinical Features of 69 Cases with Coronavirus Disease 2019 in Wuhan, China. Clin Infect Dis 71(15), 769-777.