
Abstract
This research paper focuses on rainfall variations in Tamil Nadu, India using Wavelet, Linear regression and Artificial Neural Networks model from 2004 to 2017. As the rainfall is the key factor in understanding climate change, the seasonal datasets from 2004-2017 of Tamil Nadu state has been taken for study. The salient feature of this study is the application of Neural Networks and wavelet analysis. It reveals that the rainfall variations are ambiguous that it does not maintain a constant pattern. Wavelet coefficients of multiresolution spectrogram reveals that the intensity of rainfall in each year. Linear regression model divulge the pattern of rainfall followed in every season and the results show that except winter season all other season suffers deficient rainfall. The deficiency of rainfall may be due to different parameters like ElNino or LaNina pattern or global warming. Results showed that all seasons except winter does not maintain consistency in the rainfall variability. Winter season provides the positive slope values of 4.7 and 0.6 for January and February respectively. Moreover Artificial Neural Networks training provides prominent results of Regression value 0.98 which is comparably high with other seasons taken for study.
Author Contributions
Academic Editor: Babak Mohammadi, Hohai Univeristy, Nanjing, China
Checked for plagiarism: Yes
Review by: Single-blind
Copyright © 2020 A. Stanley Raj, et al.
 This is an open-access article distributed under the terms of the Creative Commons Attribution License, which permits unrestricted use, distribution, and reproduction in any medium, provided the original author and source are credited.
Competing interests
The authors have declared that no competing interests exist.
Citation:
Introduction
Rainfall a natural occurrence plays major role in determining groundwater level, and in particular helps agricultural sector. Rainfall is considered to be the fundamental sector and it has major contribution in the development of the country. India receives most of the rainfall on monsoon so it is very essential for understanding the rainfall pattern and its trend. Rainfall pattern was analysed by various researchers of India. Rainfall pattern of Krishna-Godavary river basin was analysed by Jaagannadha sarma, 2005 1. Rainfall variation analysis of Vattamalaikarai subbasin of Tamil Nadu was studied by Vennila ,2007 2. Rajeevan et al. 2001 3 and Pai, 2006 4 studied the anomaly of Indian monsoon rainfall. In Indian subcontinent the trend and magnitude of warming over is steady over the past century with global trend 5, 6, 7. Several studies over the pattern of rainfall showed that there is no evident of increasing or decreasing trend in average rainfall in India 8, 9, 10, 11. Some studies revealed that there is considerable change in trend of rainfall over regional scale 11, 12, 13, 14, 15, 16. But in many regions of Asia though there is decreasing trend in rainfall 17, 18, 19, 20, 21, 22. Aghelpour et al., 2019 23 applied long term change in the monthly forecasting model using statistical evaluation techniques like SARIMA, SVR and SVR-FA in Iran. Biazar et al., 2019 24 applied the sensitivity analysis for evaluating the evapotranspiration in humid regions. Roozbeh et al., 2018 25 applied firefly optimization algorithm coupled with support vector regression to predict evaporation in Northern Iran. Babak Mohammadi et al., 2020 26 applied ANFIS with shuffled frog leaping algorithm for river flow forecast model. Jahani and Mohammadi, 2019 27 applied ANN and empirical methods to estimate daily global solar radiation in Iran. Afshin Ashrafzadeh, 2019 28 applied integrative data intelligence model for evaporation estimates over Northern Iran. Thus it is very important to study the rainfall pattern using standard methodologies.
Rethinking the limits of Climate Change
For past few years there has been a continuous increase in the temperature of Tamil Nadu which led to increase in global warming and reduction in the rainfall days. Tamil Nadu receives rainfall two times a year – southwest monsoon, from July to September and Northeast monsoon, from October to December.
According to Tamil Nadu State Action Plan for Climatic Change (TNSAPCC), the trend in the past decade has shown the southwest monsoon has been decreasing from 48% to 24%, and the northeast monsoon has been increasing from 34% to 63%. Thus average rainfall in Tamil Nadu may not vary but the distribution changes. Due to the climatic change there has been increase in the intensity of carbon dioxide, soil erosion, rise in sea levels which led to cyclones, drastic increase in pests and diseases 29.
Weather- which is always changing- is comprised of the following elements:
i) Air temperature - the degree of hotness or coldness of the air.
ii) Air pressure – the force of air above an area.
iii) Humidity– a measure of the amount of the water vapour in the air.
iv) Precipitation or rainfall - any form of water, either liquid or solid, (rain or snow), that falls from cloud and reaches the ground.
Weather forecasting is the application of science and technology to predict the conditions of the atmosphere for a given location and time. Human beings have attempted to predict the weather informally for millennia and formally since the 19th century. Weather forecasts are made by collecting quantitative data about the current state of the atmosphere at a given place and using scientific understanding of atmospheric processes to project how the atmosphere will change.
Study Area
The state of Tamil Nadu is situated in the southern part of the country between north latitude between 8° 5' and 13° 35' east longitude between 76° 15' and 80° 20' 1 . The total area of the state is 1,30,058 sq km making it the eleventh largest state in the country (Figure 1). Tamil Nadu has 32 districts. Tamil Nadu is one of the important Coastal States having a coastline of 1076 Kms. To its east is the Bay of Bengal and at its southernmost tip is the town of Kanyakumari, which is the meeting point of the Arabian Sea, the Bay of Bengal, and the Indian Ocean.
Figure 1.Tamil Nadu – Study area map
Tamil Nadu can be divided broadly into two natural divisions (a) the coastal plains and (b) the hilly western areas. The average temperature in the hilly areas varies between a minimum of 21.27o C to a maximum of 35.86o C. The average temperature in the plains varies between a minimum of 10.46o C to 24.86o C.
Out of 15 agro-climatic zones of India as per Planning Commission of India, Tamil Nadu comes under two zones, namely Southern Plateau and Hills region and East Coast and Hills region . Under National Agricultural Research Project of ICAR, with in the broad classification of Planning Commission’s 15 agro-climatic zones, Tamil Nadu has been divided in to seven agro climatic sub-zones and those are
North western zone
North eastern zone,
Western zone,
Cauvery Delta zone,
Southern zone,
High rainfall zone and
High Altitude and
Hilly zone
Methodology
Wavelet Analysis
Wavelet transform plays major role in analysing time series data efficiently. Event related potential determination can be easily done through this transformation more clearly. The spatial and temporal information will provide the real time data strategy in eagle’s eye. Advantages over the conventional time-frequency analysis lies in decompose the signal of any time-frequency multiresolution functions 30. The admissibility condition is as follows
ψ (t) ϵ L2 (R) satisfies certain admissibility conditions as
 (1)
(1)
ψ(t) is called wavelet; (ω) is fourier transform of

ψ(t). The Continuous Wavelet Transform (CWT) is defined as the sum over all time of the signal multiplied by scaled, shifted versions of the wavelet function,
 (2)
(2)
 (3)
(3)
CWT uses discrete sampling of data in order to obtain the finer details depends on the scaling parameter of the wavelet. Finer resolution will obtain from increased computational time and more memory required calculating the coefficients 31. Multiresolution analysis (MRA) is formed on the basis of orthonormal supported wavelet. Its applications is rapidly developing in various fields of science since the representation of particular information gives more clear picture than other transformation algorithms like Fourier and Short Term Fourier Transform (STFT). Wavelet has been applied many areas of research including flood forecast analyses and river flow models 32, 33, 34, 35. Figure 2 shows Wavelet coefficients of multiresolution scalogram 2004-2017 of winter season. This reveals that the premonsoon season prevails more rainfall randomly. It is not consistent. Thus the intensity is maximum at various portions of this spectrogram. Figure 3, Figure 4 and Figure 5 represents the multiresolution scalogram of Pre Monsoon, Monsoon and Post monsoon respectively.
Figure 2.Multiresolution wavelet spectrogram for Winter season in Tamil Nadu (2004-2017)
Figure 3.Multiresolution wavelet spectrogram for Pre Monsoon season in Tamil Nadu (2004-2017)
Figure 4.Multiresolution wavelet spectrogram for Monsoon season in Tamil Nadu (2004-2017).
Figure 5.Multiresolution wavelet spectrogram for Post Monsoon season in Tamil Nadu (2004-2017)
Artificial Neural Networks
Neural networks are simplified imitations of the central nervous system, and obviously therefore, have been motivated by the kind of computing performed by the human brain. The structural constituents of a human brain termed neurons are the entities, which perform computations such as cognition, logical inference, pattern recognition and so on. Hence the technology, which has been built on a simplified imitation of computing by neurons of a brain, has been termed Artificial Neural Systems (ANS) technology or Artificial Neural Networks (ANN) or simply Neural Networks. It has been called by various other names viz., Connectionist Networks, Neuro-Computers, Parallel Distributed Processors etc. Also neurons are referred to as neurodes, Processing Elements (PEs), and nodes.
A human brain develops with time and this, in common parlance is known as experience. Technically, this involves the ‘development’ of neurons to adapt themselves to their surrounding environment, thus, rendering the brain plastic in its information processing capability. When this plastic nature be applied to the rainfall parameters, this human brain based networks succumb the adaptive solution for the problem, thus renders the user to attain maximum likelihood estimation on most of the undetermined non-linear problems. Further, ANN also can maintain the stability i.e. the adaptive capability of an ANN in the face of changing environments. Thus, the stability-plasticity issue is of great importance to ANN architectures. This is so since ANN systems essentially being learning systems need to preserve the information previously learnt but at the same time, need to be receptive to learning new information. Training with more number of synthetic datasets will help the ANN to estimate the output model parameters that are very much to determine the characteristics of inverse problems in atmospheric and geosciences 36, 37, 38, 39, 40. (Table 1)
Table 1. Represents the Artificial Neural Networks training parameters| S. No | Neural Networks Architecture | Training parameters and values |
|---|---|---|
| 1. | Number of Layers | 3 (Input, Hidden and Output) |
| 2. | Algorithm | Levenberg-Marquardt Optmization |
| 3. | Learning | Supervised |
| 4. | Data Preprocessing | Normalization |
| 5. | Data Partition | 70% (Training), 15% (Testing), 15% validation |
| 6. | Momentum constant | 0.7 |
| 7. | Learning Rate | 0.9 |
| 8. | Activation Function (Hidden unit) | tansig |
| 9. | Activation Function (Output unit) | linear |
| 10. | Number of neurons in hidden layer | 25 |
| 11. | Number of epochs | 1000 |
Results and Discussion
Strategy of Rainfall Variations
Winter
Figure 6 shows the linear regression graph for winter season of Tamil Nadu. It shows that during the month of January, slope increases gradually with the value of 4.7057 whereas in the month of February slope increases slowly at the rate of 0.67714. Figure 10 shows the ANN predicted rainfall variation bar graph with error percentage.
Figure 6.Linear regression for Winter season in Tamil Nadu from 2004-2017.
Pre Monsoon
During the month of March, rainfall decreases at the rate of -1.8202 and Aril and May month it increases slope increases to certain value of 1.8202 and 1.6497 respectively (Figure 7). (Figure 11) shows the ANN predicted premonsoon rainfall variation with error percentage.
Figure 7.Linear regression for Pre Monsoon season in Tamil Nadu from 2004-2017.
Monsoon
Linear regression for the month of June, August reveals the increasing trend with the slope value of 1.16 and 0.96308 whereas during the month of July and September it shows the steep decline of rainfall with a value of -2.6073 and -2.89 respectively (Figure 8). ANN forecasted model for monsoon rainfall variation is shown in Figure 12.
Figure 8.Linear regression for Monsoon season in Tamil Nadu from 2004-2017.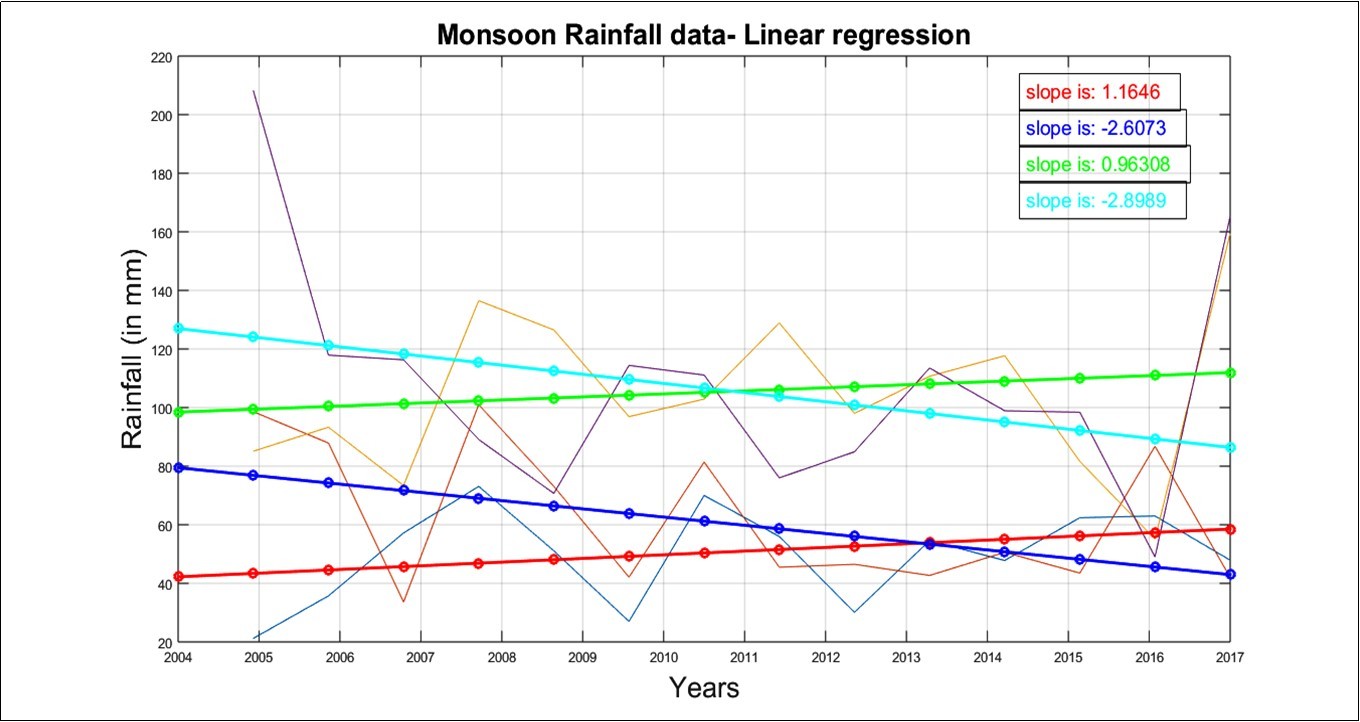
Post Monsoon
For the month of October, November and December i.e., North East (NE) monsoon season, the state receives deficient rainfall (Figure 9) with which the slope value decreases for October (-10.58), November (-10.58) and December (-0.5498). This reveals that the South West (SW) monsoon brings more rain than NE monsoon for the state. Figure 13 reveals the ANN forecast results of post monsoon season.
Apart from the effect of monsoon, the rainfall variation may occur due to ElNino/La Nina effect. (Table 2)
Table 2. Represents the error percent and performance of ANN training| S.No. | Season | RMSE | NRMSE | R Value | Computational Time (sec) |
| 1. | Winter | 2.376 | 0.1978 | 0.985 | 7.150 |
| 2. | Pre Monsoon | 3.5788 | 0.2184 | 0.694 | 2.246 |
| 3. | Monsoon | 2.8127 | 0.1166 | 0.9405 | 8.035 |
| 4. | Post Monsoon | 8.4395 | 0.2307 | 0.7987 | 2.190 |
Figure 9.Linear regression for Post Monsoon season in Tamil Nadu from 2004-2017.
Figure 10.Artificial Neural Networks forecast model for Winter season in Tamil Nadu from 2004-2017.
Figure 11.Artificial Neural Networks forecast model for Pre Monsoon season in Tamil Nadu from 2004-2017.
Figure 12.Artificial Neural Networks forecast model for Monsoon season in Tamil Nadu from 2004-2017.
Figure 13.Artificial Neural Networks forecast model for Post Monsoon season in Tamil Nadu from 2004-2017.
Conclusion
The investigation of rainfall data for all the seasons in Tamil Nadu in India had revealed that the trends of annual and seasonal rainfall. Temporal variations are analyzed using linear regression method and Artificial Neural Network for the year 2004 - 2017. This examination demonstrated significant changes in seasonal rainfall variations in Tamil Nadu during the year 2004-2017. The rainfall trend shows that there is a slow decrease of rainfall in the pre monsoon season. Wavelet trend shows the intensity of rainfall is completely distributed and it is not consistent. The distribution of rainfall over the years is completely random and it cannot be predicted or forecasted easily. Neural Networks attempts to estimate and the error percentage are very less in training the winter season. Thus winter maintains some consistency in rainfall and other error percent of neural networks are very high when compared with other seasons. Artificial neural network methods are used to predict the rainfall values for the year 2004-2017 and the predicted values are compared with the actual value of rainfall. The errors between the actual and predicted value are plotted. Such predictions are done with the help of MATLAB R2012a. The variation of temperature and rainfall and the prediction of rainfall would make a helpful guide for possible crop planning and also used for irrigation and agriculture.
Acknowledgments
We would like to express our sincere gratitude to the Management of Loyola College, Chennai and SDNB Vaishnav College, Chennai for providing permission to publish this article.
References
- 1.Sarma Jagannadha, V. (2005) Rainfall pattern in the coastal zone of Krishna Godavary basin Andhra Pradesh India. Journal of applied hydrology. Vol.XVIII.No.1&2 111.
- 2.Vennila G. (2007) Rainfall variation analysis of Vattamalaikarai sub basin, Tamil Nadu. , Journal of applied hydrology 3, 5059.
- 3.Rajeevan M. (2001) Prediction of Indian summer monsoon: Status, problems and prospects. , Curr. Sci. India 81, 1451-1457.
- 4.D S Pai, Rajeevan M. (2006) Empirical prediction of Indian summer monsoon rainfall with different lead periods based on global SST anomalies. , Meteorol. Atmos. Phys 92, 33-43.
- 6.Arora M, N K Goel, Singh P. (2005) Evaluation of temperature trends over India. , Hydrol. Sci. J 50(1), 81-93.
- 7.S K Dash, R K Jenamani, S R Kalsi, S K Panda. (2007) Some evidence of climatic change in twentieth–century India. , Climatic Change 85, 299-321.
- 8.D A Mooley, Parthasarathy B. (1984) Fluctuations in all – India summer monsoon rainfall during 1871–1978. , Climate Change 6, 287-301.
- 10.Lal M. (2001) Climatic change – implications for India’s water resources. , J. Ind. Water Resour. Soc 21, 101-119.
- 11.Kumar R M R, Shenoi S S S, Shankar D. (2004) Monsoon onset over Kerala and Premonsoon rainfall peak.
- 12.Koteswaram P, Alvi S M A. (1969) Secular trends and periodicities in rainfall at west coast stations in India. , Current Science 101, 371-375.
- 13.P, B. (1973) Trends and periodicities of rainfall over India. , Monthly Weather Review 101, 371-375.
- 14.V K Raghavendra. (1974) Trends and periodicities of rainfall in sub-divisions of Maharashtra state. , Indian J. Met. Geophys 25, 197-210.
- 15.Chaudhary A, V P Abhyankar. (1979) Does precipitation pattern foretell Gujarat climate becoming arid. , Mausam 30, 85-90.
- 16.Kumar V, S K Jain. (2009) Trends in seasonal and annual rainfall and rainy days in Kashmir valley in the last century. , Quatern. Int doi:, 10-1016.
- 17.Khan T M A, O P Singh, Rahman Sazedur. (2000) Recent sea level and sea surface temperature trends along the Bangladesh coast in relation to the frequency of intense cyclones. , Mar. Geo-desy 23, 103-116.
- 18.A B Shrestha, C P Wake, J E Dibb, P A Mayewski. (2000) Precipitation fluctuations in the Nepal Himalaya and its vicinity and relationship with some large scale climatological parameters. , Int. J. Climatol 20, 317-327.
- 19.M Q. (2002) Global warming and changes in the probability of occurrence of floods in Bangladesh and implications. , Glob. Environ. Change 12, 127-138.
- 20.Lal M. (2003) Global climate change: India's monsoon and its variability. , J. Environ. Stud. Policy 6, 1-34.
- 21.S K Min, W T Kwon, E H Parkand, Choi Y. (2003) Spatial and temporal comparisons of droughts over Korea with East Asia. , Int. J. Climatol 23, 223-233.
- 22.B N Goswami, Venugopal V, Sengupta D, M S, P K Xavier. (2006) Increasing trend of extreme rain events over India in a warming environment. , Science 314, 1442-1445.
- 23.Aghelpour P, Mohammadi B, S M Biazar. (2019) Long-term monthly average temperature forecasting in some climate types of Iran, using the models SARIMA, SVR, and SVR-FA. Theor Appl Climatol 138. 1471-1480.
- 24.S M Biazar, Dinpashoh Y, V P Singh. (2019) Sensitivity analysis of the reference crop evapotranspiration in a humid region. , Environ Sci Pollut Res 26, 32517-32544.
- 25.Moazenzadeh Roozbeh. (2018) Babak Mohammadi, Shahaboddin Shamshirband & Kwok-wing Chau. , Engineering Applications of Computational Fluid Mechanics 12, 584-597.
- 26.Mohammadi Babak, Nguyen. (2020) Thi Thuy Linh,Quoc Bao Pham,Ali Najah Ahmed,Jana Vojteková,Yiqing Guan,S.I. Abba &Ahmed El-Shafie.
- 27.Jahani B, Mohammadi B. (2019) A comparison between the application of empirical and ANN methods for estimation of daily global solar radiation in Iran. Theor Appl Climatol 137. 1257-1269.
- 29.Department of Environment, Government of Tamil Nadu (2014) Tamil Nadu State Action Plan on climate change 2.0.
- 30.Mallat S G. (2009) Denoising, In: A wavelet tour of signal processing: the Sparse way, Elsevier/Academic Press. , ISBN 13, 978-0.
- 31.Graps Amara. (1995) . published by , Los Vaqueros Circle, Los Alamitos, CA 90720, USA, IEEE Computational Science and Engineering, Summer 1995.
- 32.Adamowski J. (2007) Development of a short-term river flood forecasting method based on wavelet analysis. , Warsaw Polish Academy of Sciences Publication 172.
- 33.AdamowskiJ(2008a) Development of a short-term river flood forecasting method for snowmelt driven floods based on wavelet and cross-wavelet analysis. , Journal of Hydrology 353(3), 247-266.
- 34.AdamowskiJ.River flow forecasting using wavelet and cross-wavelet transform models. , Journal of Hydrological Processes 25, 4877-4891.
- 35.Adamowski J.Sun K (2010).Development of a coupled wavelet transform and neural network method for flow forecasting of non-perennial rivers in semi-arid watersheds.Journal of Hydrology390(1–2):. 85-91.
- 36.Srinivas Y, Stanley Raj A. (2012) Hudson Oliver D.,Muthuraj D.,Chandrasekar N. , Geoscience 3(5), 729-736.
- 37.Srinivas Y, Stanley Raj A, Hudson Oliver D, Muthuraj D, Chandrasekar N. (2013) A novel and proficient algorithm for the inversion of geoelectrical resistivity data using Adaptive Neuro Fuzzy Inference System (ANFIS). International journal of recent scientific research. 4(4), 485-489.
- 38.Raj Stanley, Y Srinivas A, Muthuraj D Hudson Oliver D. (2014) A novel and generalized approach in the inversion of geoelectrical resistivity data using Artificial Neural Networks (ANN). , Journal of Earth System Sciences 123(2), 395-411.
Cited by (1)
- 1.Raj A. Stanley, Oliver D. Hudson, Srinivas Y., Viswanath J., 2020, The impact of rainfall on groundwater table in Chennai city, India: GIS and wavelet approach, Sustainable Water Resources Management, 6(5), 10.1007/s40899-020-00447-y