Intriguing Humans and Primates chromosomes 4
Abstract
The global analysis of 3 human genomes of increasing levels of evolution (neanderthal / sapiens build34 of 2003 / sapiens hg38 of 2013) reveals 2 levels of numerical constraints controlling, structuring and optimizing the DNA sequences of these genomes.
A global constraint - which we will call "HGO" for "Human Genome Optimum" - optimizes the genome at its global scale of 3.5 billion base pairs. This same operator when applied to each of the 24 individual chromosomes reveals a hierarchical structure of these 24 chromosomes according to a numerical spectrum of amplitude ½ Phi extending from chromosome 4 to chromosome 19. This first level of comparison reveals a very Great analogy between these 3 genomes.
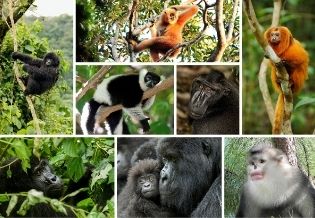
Then we introduce a global analysis method of roughness or fractal texture of the DNA sequences at the level of each chromosome. After having demonstrated that the chromosome4 seems to play a privileged role in the human genome, radically differentiating it from the 23 other chromosomes, we limit the study to the exhaustive analysis of different whole chromosomes4 relative to the 6 primates Homosapiens, Neanderthal, Chimpanzee, Orang-outan, Gorilla and Macaque. There are then remarkable resonances and periods - based on the sequences of Fibonacci and Lucas - totally differentiating the chromosomes 4 of these different primate species: 21 base pairs period for the chimpanzee and the urang-outan, 34 bases pairs period for Man, and 55 base pairs period for the gorilla. Finally, the major result is that the comparative analysis of the respective chromosomes4 of sapiens and neanderthal shows for the first time major differences in long-range fractal structures between the DNA sequences of these two genomes. Thus, while the chromosome4 of sapiens has an obvious resonance of 34 nucleotides, that of Neanderthal seems "torn" between two attractors of fractal textures, one on this same resonance 34, but with a roughness radically different from that of sapiens, While the other resonance is tuned to the number of Lucas 123. Finally, on a more theoretical level, this method reveals properties of "discrete digital standing waves" such as periods, resonances, phase shifts or phase positions. To conclude, we suggest that this chromosome4 could possibly play a role as a "referential" with respect to each of the 23 other chromosomes of the nuclear genome and possibly also with respect to the mitochondrial mtDNA genome.
Author Contributions
Academic Editor: Detlef Wegener, Brain Research Institute, Center for Cognitive Science, University of Bremen.
Checked for plagiarism: Yes
Review by: Single-blind
Copyright © 2018 Jean-claude PEREZ
 This is an open-access article distributed under the terms of the Creative Commons Attribution License, which permits unrestricted use, distribution, and reproduction in any medium, provided the original author and source are credited.
Competing interests
The authors have declared that no competing interests exist.
Citation:
Introduction
The main question to which this article will answer is: « Of the 24 human chromosomes besides the 2 chromosomes X and Y is there a chromosome that would be radically different from all the other chromosomes? ».
The answer is « yes »: This chromosome exists: there is the chromosome4 ...
"But what is a " radically different " chromosome? A chromosome that would be differentiated by global properties that would distinguish it exclusively from all other chromosomes ...
Perhaps even properties that would allow us to discover a kind of quantum leap radically distinguishing the human genome from those of the primates, the genome of sapiens from that of neanderthal?
Thanks to the CRISPR technology (Clustered regularly interspaced short palindromic repeats), it is now possible to modify locally the genomes, and particularly the human genome 1, 2.
On the other hand, mathematics plays a central role from the deepest levels of matter like the periodic table of the Elemens of Dimitri Mendeleev 3.
Almost simultaneously, the fractal and global structures of the human genome were demonstrated 4, 6, 7, 8.
In such a context, apart from ethical questions, can a local technology as powerful as CRISPR be applied, ignoring its possible effect on the possible global and long-range equilibria and fine-tuning at the whole chromosome scale or even the entire genome?
For more than 25 years, we have been looking for possible global, even digital, structures that would organize DNA, genes, chromosomes, and even whole genomes 9, 10, 11, 12, 13, 14, 15, 16, 17, 18.
However, it is only by deepening the notion of "fractal periodicity", outlined in 12, 19, and we will highlight here that we have re-discovered the major role that this ratio GC / TA at both scales of each whole individual chromosomes and whole genome 17, 20. We then demonstrate a sort of "hierarchical classification" of the 24 chromosomes. In this hierarchy, the chromosome4 seems to play a major and privileged role.
Here is the summary synthesis: By comparing chromosome chromosome the 3 reference genomes of Neanderthal 21, Sapiens BUILD34 of 2003 22 and Sapiens HG38 of 2013 23, we demonstrate the evidence of « fractal periods » and « Resonance periods» characterizing each of the 24 human chromosomes. As illustrated in Figure 1 below, these resonances make it possible to differentiate the respective genomes of Neanderthal and Sapiens on the global scale of the chromosome (here chromosome 4). Here, a resonance of 34 nucleotides is common to both chromosomes 4 of Sapiens and Neanderthal, however, the respective forms of these resonance curves are radically different.
Figure 1.As will be demonstrated here, the 2 respective Chromosomes 4 of Neanderthal and Sapiens HG38 share a "resonance" of 34 bp, however, these two radically different resonance curves illustrate a major differentiation of the 2 human species at the GLOBAL scale of chromosome 4.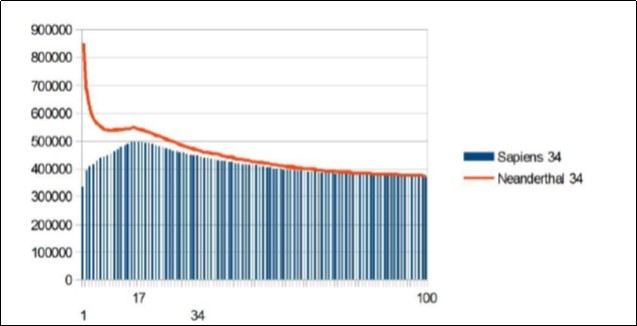
Methods
Analysed Whole Human Genomes:
We analyzed completely and systematically each of the 24 chromosomes of each of the following 3 reference genomes:
Neanderthal genome
-Neanderthal genome (2014) ref (21) http://www.nature.com/nature/journal/v505/n7481/full/nature12886.html
Sapiens Build34 (2003) human reference genome ref (22)-Sapiens Build34 (2003) genome http://www.nature.com/nature/journal/v431/n7011/full/nature03001.html
Sapiens HG38 (2013) human reference genome ref (23)
- Sapiens HG38 (2013) genome https://www.ncbi.nlm.nih.gov/grc/human
Analysed Whole Primates Genomes:
chimp
http://www.ensembl.org/Pan_troglodytes/Info/Index
gorilla
http://www.ensembl.org/Gorilla_gorilla/Info/Index
orangutan
http://www.ensembl.org/Pongo_abelii/Info/Index
macaque
http://www.ensembl.org/Macaca_mulatta/Info/Index
Computing the HGOs :
Let's distinguish now the 3 types of HGO:
1/ Theoretical HGO (tHGO)
(3-PHI)÷2 = 0.6909830056
where PHI is the Golden Ratio PHI = 1.618033989
2/ Reference woman HGO (rwHGO)
0.6913477936
error (tHGO – rwHGO) =
0.6909830056 - 0.6913477936
¯0.0003647879784
and
Reference man HGO (rmHGO)
0.6922864236
error (tHGO – rmHGO) =
¯0.001303417973
0.6909830056 - 0.6922864236
3/ HGO is computed cumulting C+G and T+A nuclotides populations from each DNA strand.
Example here : HGOwoman =
( (C+G population from strand1) + (C+G population from strand2) )
/ ( (T+A population from strand1) + (T+A population from strand2) )
Then :
HGO woman =
( (sum C+G single strand 1 to 22 chromosomes) + (sum C+G chrX)
+ (sum C+G single strand 1 to 22 chromosomes) + (sum C+G chrX) )
/ [ (sum T+A single strand 1 to 22 chromosomes) + (sum T+A chrX)
+ (sum T+A single strand 1 to 22 chromosomes) + (sum T+A chrX) ]
HGO man =
( (sum C+G single strand 1 to 22 chromosomes) + (sum C+G chrX)
+ (sum C+G single strand 1 to 22 chromosomes) + (sum C+G chrY) )
/ ( (sum T+A single strand 1 to 22 chromosomes) + (sum T+A chrX)
+ (sum T+A single strand 1 to 22 chromosomes) + (sum T+A chrY) )
Recall the single stranded C+G, T+A and individual chromosome HGO values:Table 1
Table 1. Respective populations and ratios of each of the 24 chromosomes of human genome HG38 (2013).| Chromosome | C + G | T + A | ( C + G ) / ( T + A ) |
| Chromosomes UPSTREAM HGO point = (3-Phi)÷2 = 0.6909830056 | |||
| 4 | 72568001 | 117184666 | 0.6192619178 |
| 13 | 37772797 | 60210328 | 0.627347471 |
| 5 | 71611274 | 109654104 | 0.6530651511 |
| X | 61221521 | 93671508 | 0.6535767632 |
| 6 | 67360020 | 102718502 | 0.6557729979 |
| 3 | 78577742 | 119522393 | 0.6574311309 |
| 18 | 31856106 | 48233499 | 0.6604560453 |
| Y | 10572683 | 15842360 | 0.66736793 |
| 8 | 58133960 | 86634176 | 0.6710280248 |
| 2 | 96769083 | 143779145 | 0.6730397722 |
| 7 | 64696843 | 94273288 | 0.686269084 |
| 12 | 54275482 | 78862334 | 0.6882307338 |
| 14 | 36982791 | 53585358 | 0.6901659778 |
| Chromosomes DOWNSTREAM HGO point = (3-Phi)÷2 = 0.6909830056 | |||
| 21 | 16411625 | 23676994 | 0.693146478 |
| 9 | 50270473 | 71520077 | 0.70288617 |
| 11 | 55885058 | 78648684 | 0.7105657102 |
| 10 | 55359481 | 77903481 | 0.7106162689 |
| 1 | 96166571 | 134314441 | 0.7159808751 |
| 15 | 35578844 | 49062481 | 0.7251741713 |
| 20 | 28010605 | 35933652 | 0.7795089962 |
| 16 | 36472718 | 45333225 | 0.8045471726 |
| 17 | 37575444 | 45344760 | 0.8286612169 |
| 22 | 18406838 | 20752939 | 0.8869509037 |
| 19 | 28015712 | 30425046 | 0.9208108346 |
We deduce for the genome Sapiens HG38:
HGO woman =
( (sum C+G single strand 1 to 22 chromosomes) + (sum C+G chrX)
+ (sum C+G single strand 1 to 22 chromosomes) + (sum C+G chrX) )
/ ( (sum T+A single strand 1 to 22 chromosomes) + (sum T+A chrX)
+ (sum T+A single strand 1 to 22 chromosomes) + (sum T+A chrX) )
HGO woman = [ (1128757468 + 61221521) + (1128757468 + 61221521) )
/ (( 1627573573 + 93671508 ) + ( 1627573573 + 93671508 ) )
= 2379957978 / 3442490162 =0.6913477936
HGO man =
( (sum C+G single strand 1 to 22 chromosomes) + (sum C+G chrX)
+ (sum C+G single strand 1 to 22 chromosomes) + (sum C+G chrY) )
/ ( (sum T+A single strand 1 to 22 chromosomes) + (sum T+A chrX)
+ (sum T+A single strand 1 to 22 chromosomes) + (sum T+A chrY) )
HGO man =([ (1128757468 + 61221521) + (1128757468 + 10572683 ) )
/ (( 1627573573 + 93671508 ) + ( 1627573573 + 15842360 ) )
2329309140 / 3364661014 = 0.6922864236
Computing Fractal Periods and Resonances Summary:
We introduce here a method of global analysis of the roughness or fractal texture of the DNA sequences at the chromosome scale. To do this, we generalize the method of numerical analysis of the "Master Code of Biology" 14, 19. Thus, we restructure the sequence into different generic sequences based on "meta codons" no longer triplets of 3 nucleotides but values ranging from 17 to 377 nucleotides, ie 360 simulations. This method of analysis will then reveal, in most cases, discrete waves or interferences, most often dissonances. However, sometimes there will emerge kinds of resonances where all scales of analysis appear to be in symbiosis.
The discrete interferences fields resulting from the analysis of an entire chromosome are therefore a three-dimensional space:
Dim y (vertical) restructuring in meta codons of lengths 17 to 377 nucleotides
Dim x (horizontal) derivatives mobile1 such that 1/2 1/3 1/4 ... 1 / n
Dim z cumulated populations from the "Master code" operators (14, 19).
The + 1 / -1 derivatives will be of type increase, ie +1 if derivative increasing and will be of type decrease, ie -1 if derived decreasing.
In this context we will explore these 3d spaces in 2 forms:
-Horizontal, meta codons dimension: curves for a dimension of meta codons given example, 22 in the example "resonances" below (see Figure 2).
-Vertical, spectral differentiation: discrete series d2-d1 is +1 if increase and -1 if decrease (see Figure 3).
Figure 2.Zoom on vertical scan method revealing PERIOD = 22 from HG38 reference chromosome21.
Figure 3.Evidence of a resonance of 22bp period in the whole HG38 human reference chromosome21.
We represent in the top the +1 and in low the -1, (see all the other examples below). Table 2
Table 2. Example of three-dimensional interference fields (chromosome21 Sapiens HG38 Figures 2 and 3).| Dim x | d1 | d2 | ….d100 | ||||
| 0 | 1 | 2 | 3 | 4 | 5 | ||
| 17 | 1298833 | 1181005 | 1133041 | 1103633 | 1087486 | ||
| 18 | 1029171 | 1074033 | 960839 | 1000920 | 1028712 | ||
| 19 | 1091521 | 982429 | 937709 | 912626 | 975473 | ||
| 20 | 878537 | 903906 | 914801 | 848319 | 927631 | ||
| 21 | 933380 | 834734 | 893561 | 783714 | 885361 | ||
| 22 | 761233 | 774174 | 779102 | 791545 | 786854 | ||
| 23 | 809977 | 867877 | 764596 | 735631 | 755377 | ||
| 24 | 852759 | 779786 | 750287 | 735631 | 726226 | ||
| 25 | 710190 | 727911 | 736109 | 742027 | 699579 | ||
| Dim y | |||||||
| …377 |
Horizontal scan example: 22 761233 774174 779102 783714 786854 …/...
(see Figure 2)
Vertical scan example: 1 if d2>d1 and -1 if d2<d1 then : -1 1 -1 1 -1 1 1 -1 1 -1 1 1 …/…
(see Figure 3).
These two independent methods lead in all the cases analyzed to the same period value: here, for example, the period "horizontal scan" is a resonance of 22bp (Figure 2) and the period "vertical scan" is a period Of repeatability of 22bp also (Figure 3).(Figure 4)
Figure 4.Confirmation of a 22bp period in the whole HG38 human reference chromosome21.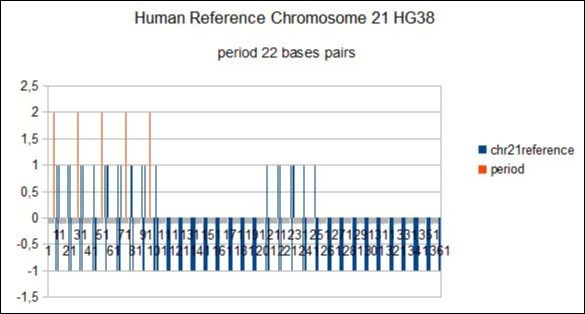
A third complementary method is presented here: knowing the period determined and confirmed by the two previous methods, we segment the complete sequence of the chromosome by consecutive segments according to this period, for example here for the chromosome21, we will "cut" the entire sequence of the chromosome in successive sections of 22 bases, the length of the period discovered. Then we record for each segment the C + G populations on the one hand and T + A on the other hand.
We then represent the cumulative distribution curve of these different CG and TA populations throughout the chromosome sequence. Table 3
Table 3. This table shows a C+G top for 8 bases value within 22 bases segments distribution.| 7 | 8 | 9 |
| 205735 | 230173 | 219804 |
| 46083 | 75340 | 106183 |
Figure 5.Gauss like CG / TA distribution within the whole human HG38 chromosome21 segmented by 22 bases.
Results
High Correlation Level between Neanderthal and Sapiens Chromosomes and Genomes:
HGO of the 3 Whole genomes Neanderthal, Sapiens BUILD34 and Sapiens HG38:
The three respective genomes that we compare here differ on the one hand by their respective evolution levels, on the other hand by the sample of individual genomes of which they form the syntheses, and finally by the precision of the sequencing d DNA.
The 3 analysed genomes are:
-Neanderthal genome (2014) ref (21) http://www.nature.com/nature/journal/v505/n7481/full/nature12886.html
-Sapiens Build34 (2003) genome ref(22) http://www.nature.com/nature/journal/v431/n7011/full/nature03001.html
- Sapiens HG38 (2013) genome ref (23)
https://www.ncbi.nlm.nih.gov/grc/human
Details:
Neanderthal genome: Table 4
Table 4. CG values, TA values and CG/TA ratio for each Neanderthal individual chromosome.| Chromosome | C+G | T+A | CG / TA |
| 1 | 93921245 | 131078474 | 0.7165268418 |
| 2 | 95643743 | 142066051 | 0.6732343324 |
| 3 | 77280746 | 117424062 | 0.6581338159 |
| 4 | 71580880 | 115716178 | 0.6185900817 |
| 5 | 70226370 | 107476376 | 0.6534121508 |
| 6 | 66241234 | 101032755 | 0.655641173 |
| 7 | 63125011 | 91827395 | 0.6874311419 |
| 8 | 57282820 | 85329916 | 0.6713099307 |
| 9 | 49639367 | 70503847 | 0.7040660774 |
| 10 | 54735776 | 76888948 | 0.7118809325 |
| 11 | 54505825 | 76624919 | 0.711332889 |
| 12 | 53168712 | 77134293 | 0.6893005683 |
| 13 | 36809808 | 58750163 | 0.6265481851 |
| 14 | 36099521 | 52191031 | 0.6916805495 |
| 15 | 34330462 | 47011426 | 0.7302578314 |
| 16 | 35332018 | 43552709 | 0.8112473096 |
| 17 | 35423602 | 42376615 | 0.8359233506 |
| 18 | 29701791 | 44954364 | 0.6607098479 |
| 19 | 26980384 | 28805263 | 0.936647723 |
| 20 | 26257008 | 33248228 | 0.7897265382 |
| 21 | 13968141 | 20201960 | 0.6914250399 |
| 22 | 16722627 | 18128673 | 0.9224407655 |
| X | 59660780 | 91397960 | 0.6527583329 |
| Y | 10252238 | 15400712 | 0.6656989625 |
Sapiens BUILD34 genome: Table 5
Table 5. CG values, TA values and CG/TA ratio for each Sapiens BUILD34 individual chromosome.| Chromosome C+G | C+G | T+A | CG / TA |
| 1 | 92985636 | 129991923 | 0.7153185664 |
| 2 | 95862507 | 142342011 | 0.6734660156 |
| 3 | 77323283 | 117473801 | 0.6582172565 |
| 4 | 71776626 | 115885048 | 0.6193777993 |
| 5 | 70218562 | 107476659 | 0.6533377819 |
| 6 | 66306701 | 101088340 | 0.6559282802 |
| 7 | 63308643 | 92045010 | 0.6878009248 |
| 8 | 57406559 | 85482257 | 0.6715611054 |
| 9 | 49639458 | 70503940 | 0.7040664394 |
| 10 | 54607065 | 76707663 | 0.7118853953 |
| 11 | 54504832 | 76624676 | 0.7113221856 |
| 12 | 53252032 | 77229333 | 0.6895311656 |
| 13 | 36827472 | 58762399 | 0.6267183203 |
| 14 | 36099074 | 52190449 | 0.6916796979 |
| 15 | 34475948 | 47218772 | 0.7301322449 |
| 16 | 35332018 | 43552709 | 0.8112473096 |
| 17 | 35428290 | 42366911 | 0.8362254685 |
| 18 | 29702353 | 44954872 | 0.6607148831 |
| 19 | 26989388 | 28819571 | 0.9364951338 |
| 20 | 26257233 | 33248275 | 0.7897321891 |
| 21 | 14334930 | 20771708 | 0.6901180201 |
| 22 | 16745209 | 18149316 | 0.9226358172 |
| X | 59679172 | 91421368 | 0.6527923756 |
| Y | 10252459 | 15401106 | 0.6656962818 |
Sapiens HG38 genome: Table 6 and Table 7.
Table 6. CG values, TA values and CG/TA ratio for each Sapiens HG38 individual chromosome.| Chromosome | C+G | T+A | CG / TA |
| 1 | 96166571 | 134314441 | 0.7159808751 |
| 2 | 96769083 | 143779145 | 0.6730397722 |
| 3 | 78577742 | 119522393 | 0.6574311309 |
| 4 | 72568001 | 117184666 | 0.6192619178 |
| 5 | 71611274 | 109654104 | 0.6530651511 |
| 6 | 67360020 | 102718502 | 0.6557729979 |
| 7 | 64696843 | 94273288 | 0.686269084 |
| 8 | 58133960 | 86634176 | 0.6710280248 |
| 9 | 50270473 | 71520077 | 0.70288617 |
| 10 | 55359481 | 77903481 | 0.7106162689 |
| 11 | 55885058 | 78648684 | 0.7105657102 |
| 12 | 54275482 | 78862334 | 0.6882307338 |
| 13 | 37772797 | 60210328 | 0.627347471 |
| 14 | 36982791 | 53585358 | 0.6901659778 |
| 15 | 35578844 | 49062481 | 0.7251741713 |
| 16 | 36472718 | 45333225 | 0.8045471726 |
| 17 | 37575444 | 45344760 | 0.8286612169 |
| 18 | 31856106 | 48233499 | 0.6604560453 |
| 19 | 28015712 | 30425046 | 0.9208108346 |
| 20 | 28010605 | 35933652 | 0.7795089962 |
| 21 | 16411625 | 23676994 | 0.693146478 |
| 22 | 18406838 | 20752939 | 0.8869509037 |
| X | 61221521 | 93671508 | 0.6535767632 |
| Y | 10572683 | 15842360 | 0.66736793 |
| woman | man | |||||
| Whole Genomes | HGO ratio | Abs Error : 0.6909830055-HGO ratio | Rel error %0.6909830055/HGO ratio | HGO ratio | Abs Error : 0.6909830055-HGO ratio | Rel error %0.6909830055/HGO ratio |
| Neanderthal | 0.692252443 | ¯0.001269437 | 99.8166221 | 0.693230829 | ¯0.002247824 | 99.6757466 |
| Sapiens build34 | 0.692264312 | ¯0.001281306 | 99.8149108 | 0.693241946 | ¯0.002258941 | 99.6741482 |
| Sapienshg38 | 0.691347793 | ¯0.000364788 | 99.9472352 | 0.692286423 | ¯0.001303418 | 99.8117227 |
In Figure 6 below, it is found that the 3 HGOs calculated for the respective 3 Neanderthal, then Sapiens genomes (Build34 release of 2003 and HG38 release of 2013) are very close to the optimal ideal value of HGO = 0.6909830056 ( 99.67% for the least optimal genome).
Figure 6.The respective HGOs of 3 human genomes of varying levels of evolution are shown here.
It is also observed that female genomes (XX) are more optimal than male genomes (XY).
On the other hand, the genomes of Neanderthal and Sapiens (Build34 of 2003) have very close optimization levels. We believe this results from the fact that the precisions of their respective DNA sequencing are similar.
On the other hand, the HG38 genomes of 2013 show the most optimal levels, this is most certainly due to the deeper quality of their DNA sequencing.
HGO Spectral Hierarchy of the 24 Human chromosomes :
The following 2 figure 7 and figure 8 illustrate the hierarchical spectrum of the individual HGOs of each of the 24 chromosomes for each of the three genomes analyzed. It should be noted that the upstream / downstream tipping point lies between chromosomes 14 and 21, which is closely related to the likely mechanisms explaining trisomy21 (whose disorders involve precisely these two chromosomes).
Figure 7.HGO diversity of human chromosomes upstream of the numerical ideal attractor HGO = 0.6909830056
Figure 8.Diversity of HGOs of human chromosomes downstream of the numerical ideal attractor HGO = 0.6909830056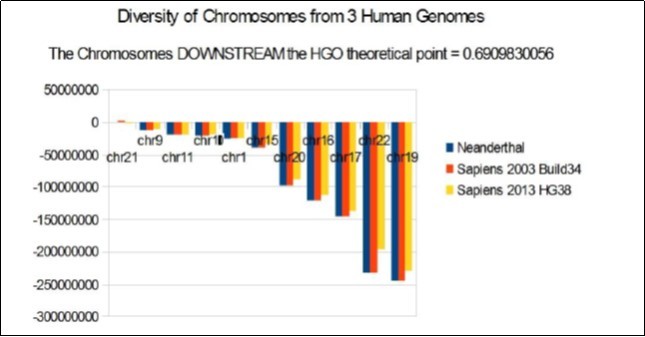
Finally, it is noted (Figure 9) that it is the downstream region that contributes most to the optimality superiority of sapiens HG38 compared to sapiens build34. However, a more detailed analysis of the upstream and downstream regions shows that the notable optimization when passing from Sapiens Builds34 2003 to HG38 2013 obeys globally (with the exception of chromosomes 13, X, Y, and 1, is 20 out of 24 chromosomes OK) - to the LOH strategy law that we present here: reduction of optimality for upstream chromosomes and improvement of optimality for downstream regions.
Figure 9.Sapiens HG38 chromosome4, the main resonance of 34 bases pairs
It is therefore remarkable that this is the same and only law which seems to control simultaneously two domains as different as: the global strategy of LOH deletions of tumors on the one hand and on the other hand the difference of evolution of the same genome following 2 increasing levels of precision DNA sequencing (Build34 2003 and HG38 2013)!
Detailed Values for HGO Chromosomes Spectral Hierarchy for the 3 Human Genomes :
Neanderthalgénome: Table 8
Table 8. CG values, TA values and sorted CG/TA ratio for each Neanderthal individual chromosome.| Chromosome | C+G | T+A | CG/TA |
| 4 | 71580880 | 1157161780.6185900817 | |
| 13 | 36809808 | 58750163 | 0.6265481851 |
| X | 59660780 | 91397960 | 0.6527583329 |
| 5 | 70226370 | 107476376 | 0.6534121508 |
| 6 | 66241234 | 101032755 | 0.655641173 |
| 3 | 77280746 | 117424062 | 0.6581338159 |
| 18 | 29701791 | 44954364 | 0.6607098479 |
| Y | 10252238 | 15400712 | 0.6656989625 |
| 8 | 57282820 | 85329916 | 0.6713099307 |
| 2 | 95643743 | 142066051 | 0.6732343324 |
| 7 | 63125011 | 91827395 | 0.6874311419 |
| 12 | 53168712 | 77134293 | 0.6893005683 |
| 21 | 13968141 | 20201960 | 0.6914250399 |
| 14 | 36099521 | 52191031 | 0.6916805495 |
| 9 | 49639367 | 70503847 | 0.7040660774 |
| 11 | 54505825 | 76624919 | 0.711332889 |
| 10 | 54735776 | 76888948 | 0.7118809325 |
| 1 | 93921245 | 131078474 | 0.7165268418 |
| 15 | 34330462 | 47011426 | 0.7302578314 |
| 20 | 26257008 | 33248228 | 0.7897265382 |
| 16 | 35332018 | 43552709 | 0.8112473096 |
| 17 | 35423602 | 42376615 | 0.8359233506 |
| 22 | 16722627 | 18128673 | 0.9224407655 |
| 19 | 26980384 | 28805263 | 0.936647723 |
Sapiens BUILD34 genome : Table 9
Table 9. CG values, TA values and sorted CG/TA ratio for each Sapiens BUILD34 individual chromosome.| Chromosome | C+G | T+A | CG / TA |
| 4 | 71776626 | 115885048 | 0.6193777993 |
| 13 | 36827472 | 58762399 | 0.6267183203 |
| X | 59679172 | 91421368 | 0.6527923756 |
| 5 | 70218562 | 107476659 | 0.6533377819 |
| 6 | 66306701 | 101088340 | 0.6559282802 |
| 3 | 77323283 | 117473801 | 0.6582172565 |
| 18 | 29702353 | 44954872 | 0.6607148831 |
| Y | 10252459 | 15401106 | 0.6656962818 |
| 8 | 57406559 | 85482257 | 0.6715611054 |
| 2 | 95862507 | 142342011 | 0.6734660156 |
| 7 | 63308643 | 92045010 | 0.6878009248 |
| 12 | 53252032 | 77229333 | 0.6895311656 |
| 21 | 14334930 | 20771708 | 0.6901180201 |
| 14 | 36099074 | 52190449 | 0.6916796979 |
| 9 | 49639458 | 70503940 | 0.7040664394 |
| 11 | 54504832 | 76624676 | 0.7113221856 |
| 10 | 54607065 | 76707663 | 0.7118853953 |
| 1 | 92985636 | 129991923 | 0.7153185664 |
| 15 | 34475948 | 47218772 | 0.7301322449 |
| 20 | 26257233 | 33248275 | 0.7897321891 |
| 16 | 35332018 | 43552709 | 0.8112473096 |
| 17 | 35428290 | 42366911 | 0.8362254685 |
| 22 | 16745209 | 18149316 | 0.9226358172 |
| 19 | 26989388 | 28819571 | 0.9364951338 |
Sapiens HG38 genome : Table 10.
Table 10. CG values, TA values and sorted CG/TA ratio for each Sapiens HG38 individual chromosome.| Chromosome C+G | T+A | CG / TA | |
| 4 | 72568001 | 117184666 | 0.6192619178 |
| 13 | 37772797 | 60210328 | 0.627347471 |
| 5 | 71611274 | 109654104 | 0.6530651511 |
| X | 61221521 | 93671508 | 0.6535767632 |
| 6 | 67360020 | 102718502 | 0.6557729979 |
| 3 | 78577742 | 119522393 | 0.6574311309 |
| 18 | 31856106 | 48233499 | 0.6604560453 |
| Y | 10572683 | 15842360 | 0.66736793 |
| 8 | 58133960 | 86634176 | 0.6710280248 |
| 2 | 96769083 | 143779145 | 0.6730397722 |
| 7 | 64696843 | 94273288 | 0.686269084 |
| 12 | 54275482 | 78862334 | 0.6882307338 |
| 14 | 36982791 | 53585358 | 0.6901659778 |
| 21 | 16411625 | 23676994 | 0.693146478 |
| 9 | 50270473 | 71520077 | 0.70288617 |
| 11 | 55885058 | 78648684 | 0.7105657102 |
| 10 | 55359481 | 77903481 | 0.7106162689 |
| 1 | 96166571 | 134314441 | 0.7159808751 |
| 15 | 35578844 | 49062481 | 0.7251741713 |
| 20 | 28010605 | 35933652 | 0.7795089962 |
| 16 | 36472718 | 45333225 | 0.8045471726 |
| 17 | 37575444 | 45344760 | 0.8286612169 |
| 22 | 18406838 | 20752939 | 0.8869509037 |
| 19 | 28015712 | 30425046 | 0.9208108346 |
2 – The Strange Case of Neanderthal and Sapiens Chromosomes 4 :
We will now analyze and compare each of the chromosomes 4 of the 3 human genomes of SAPIENS Build34 (2003),
SAPIENS HG38 (2013) and NEANDERTHAL.
Here is the study of the most advanced of these 3 genomes SAPIENS HG38 (2013). It is the most evolved in the senseof greater precision of the sequencing of its DNA. We will observe two remarkable phenomena:
On the one hand, the main resonance of 34 bases will be confirmed independently by the two methods described above.
On the other hand upstream and downstream of 34 will appear secondary harmonic resonances of Lucas (18 29 47 76 123 ...) and Fibonacci (21 55 89 144 ...).
Each of the 3 Figures below corresponds to each of the 3 types of analysis that we will use throughout this article:
Analysis of resonances and dissonances (or horizontal analysis).
The bar code analysis of periods (or vertical analysis).
The "Gauss" type analysis reveals the distribution of the proportions TA and CG by regular segments throughout the sequence.
In the following figures, we remark high selectivity to Fibonacci/Lucas numbers providing long waves : examples 18 21 29 34.Figure 10, Figure 11, Figure 12, Figure 13, Figure 14, Figure 15, Figure 16, Figure 17, Figure 18, Figure 19, Figure 20.
Is this rule universal for other Fibonacci/Lucas numbers ? We recall here Fibonacci numbers sequence
0, 1, 1, 2, 3, 5, 8, 13, 21, 34, 55, 89, 144, 233, 377, 610, 987, 1597, 2584, 4181, 6765, 10946, 17711, 28657, 46368, 75025, 121393,196418, 317811, 514229, 832040, 1346269, 2178309, 3524578, 5702887, 9227465, 14930352, 24157817, 39088169
2, 1, 3, 4, 7, 11, 18, 29, 47, 76, 123, 199, 322, 521, 843, 1364, 2207, 3571, 5778, 9349, 15127, 24476, 39603, 64079, 103682, 167761, 271443, 439204, 710647, 1149851, 1860498, 3010349, 4870847, 7881196, 12752043, 20633239, 33385282
Figure 10.Sapiens HG38 chromosome4, the main barcode-like Period of 34 bases pairs.
Figure 11.Sapiens HG38 chromosome4, the main resonance of 34 bp gauss-like distribution by segments of 34 bases.
Figure 12.Chromosome4 Sapiens HG38 Harmonic resonance of Lucas 18.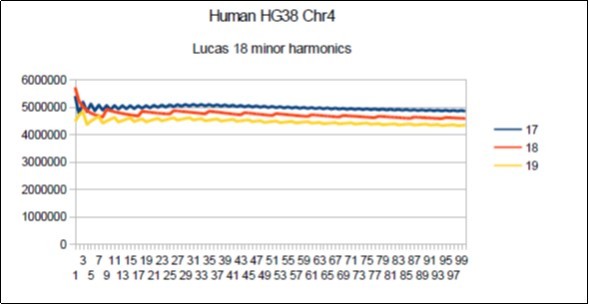
Figure 13.Chromosome4 Sapiens HG38 Harmonic resonance of Fibonacci 21.
Figure 14.Chromosome4 Sapiens HG38 Harmonic resonance of Lucas 29.
Figure 15.Chromosome4 Sapiens HG38 Harmonic resonance of Lucas 47.
Figure 16.Chromosome4 Sapiens HG38 Harmonic resonance of Fibonacci 55.
Figure 17.Chromosome4 Sapiens HG38 Harmonic resonance of Lucas 76.
Figure 18.Chromosome4 Sapiens HG38 Harmonic resonance of Fibonacci 89.
Figure 19.Chromosome4 Sapiens HG38 Harmonic resonance of Lucas 123.
Figure 20.Chromosome4 Sapiens HG38 Harmonic resonance of Fibonacci 144.
Harmonic resonances are observed for the Fibonacci and Lucas periods upstream and downstream of 34. However, the Fibonacci periods (21 55) seem more selective than the Lucas period (29 47) insofar as their harmonic waves are longer and less numerous. Figure 21.
Now we analyze and compare according to the same methods the older genome of SAPIENS Build34 (2003) and the prehistoric genome of Neanderthal.
Figure 21.Sapiens Build34 chromosome 4 29 to 34 reshapings.
In this comparative figure we note the main 34 resonances but also the 29 Lucas number harmonic secondary resonance. Figure 22, Figure 23, Figure 24, Figure 25, Figure 26, Figure 27, Figure 28, Figure 29.
Then we compare now Sapiens Build34 and Neanderthal Chomosomes4 for these Fibonacci/Lucas harmonic periods.
Figure 22.Neanderthal chromosome4 harmonic resonance Lucas 18.
Figure 23.Sapiens Build34 chromosome4 harmonic resonance Lucas 18.
Figure 24.Neanderthal chromosome4 harmonic resonance Fibonacci 21.
Figure 25.Sapiens Build34 chromosome4 harmonic resonance Fibonacci 21.
Figure 26.Neanderthal chromosome4 harmonic resonance Lucas 29.
Figure 27.Sapiens Build34 chromosome4 harmonic resonance Lucas 29.
Figure 28.Neanderthal chromosome4 MAIN resonance Fibonacci 34.
Figure 29.Neanderthal chromosome4 MAIN periods Fibonacci 34 and Lucas 123.
It will be noted that there is a 21-base DEPHASING between the sapiens barcodes (HG38 and Build34) on the one hand and the Neanderthal barcode above. It suffices to compare the positions of the first resonant bar34 in each of the 3 barcode patterns: Position 5 for Sapiens HG38 and Build34, Position 26 for Neanderthal. We deduce this phase shift of 26-5 = 21. Note that 21 is - also - a number of Fibonacci.
About possible relations between these two resonances of 34 and 123:
In the figure below we try to analyze possible links between these two resonances. We note first that 123/34 = 3.617647059 = 1 + Phi * 2 = 2 + Phi = 3 + (1 / Phi). At the same time in the figure below we have divided the first period 123 of the Neandertal barcode. As shown by the bars "-4" of the barcode graph, we have delimited this first resonance 123 in 3 sub sections: 34 55 34. This structure is symmetrical vis-à-vis the middle of the pattern 55, the 2 patterns 34 being reversed head spades on both sides.Figure 30,Figure 31, Figure 32, Figure 33, Figure 34, Figure 35, Figure 36, Figure 37, Figure 38, Figure 39, Figure 40, Figure 41, Figure 42, Figure 43, Figure 44, Figure 45.
Figure 30.Sapiens Build34 chromosome4 MAIN resonance Fibonacci 34.
Figure 31.Sapiens Build34 chromosome4 MAIN period Fibonacci 34.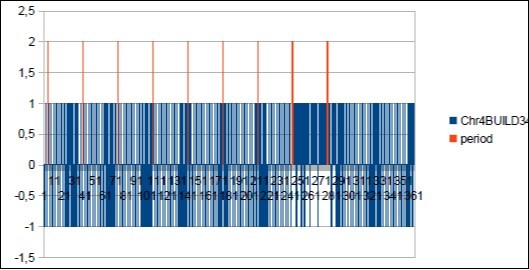
Figure 32.Neanderthal chromosome4 harmonic resonance Lucas 47.
Figure 33.Sapiens Build34 chromosome4 harmonic resonance Lucas 47.
Figure 34.Neanderthal chromosome4 harmonic resonance Fibnacci 55.
Figure 35.Sapiens Build34 chromosome4 harmonic resonance Fibonacci 55.
Figure 36.Neanderthal chromosome4 harmonic resonance Lucas 76.
Figure 37.Sapiens Build34 chromosome4 harmonic resonance Lucas 76.
Figure 38.Neanderthal chromosome4 harmonic resonance Fibonacci 89.
Figure 39.Sapiens Build34 chromosome4 harmonic resonance Fibonacci 89.
Figure 40.Neanderthal chromosome4 SECOND MAIN resonance Lucas 123.
Figure 41.Sapiens Build34 chromosome4 harmonic resonance Lucas 123.
Figure 42.Neanderthal chromosome4 harmonic resonance Fibonacci 144.
Figure 43.Sapiens Build34 chromosome4 harmonic resonance ibonacci 144.
Figure 44.Neanderthal chromosome4 harmonic resonance Lucas 199.
Figure 45.Sapiens Build34 chromosome4 harmonic resonance Lucas 199.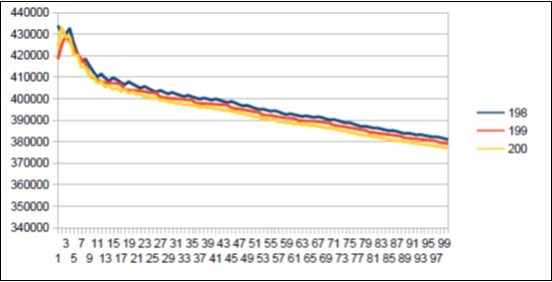
As in the case of Sapiens HG38, harmonic resonances are observed for the Fibonacci and Lucas periods upstream and downstream of 34. However, the periods of Fibonacci (55 89) and the Lucas period (47 76) situated between the two main resonances (34 and 123) of Neanderthal have their harmonic waves longer and fewer than in the corresponding cases in Sapiens Build34 which, it contains only the major resonance 34. The 2 figures below summarize and compare these 2 main resonances 34 123 of Neanderthal and 34 of Sapiens Build34.
Figure 46.Neanderthal main Fibonacci Resonance 34 and Sapiens main Fibonacci Resonance 34.
Figure 47.Neanderthal main Lucas Resonance 123 and Sapiens long wave Lucas Resonance 123.
We can here summarize the similarities and differences characterizing on the one hand the 2 chromosomes4 of Sapiens HG38 and Build34 and, on the other hand, the chromosome4 of Neanderthal. Five remarkable points emerge quickly:
a) The resonance of 34 bases is common to these 3 chromosomes.
b) The resonances 34 of the 2 Sapiens and Neanderthals differ in their forms (see figure 46) (Figure 47).
c) Point (b) can be explained by the remarkable fact that a 21-PHASE DEPHASING differentiates chromosome4 from Neanderthal of the 2 chromosomes4 of Sapiens.
d) A second major difference differentiating Neanderthal Sapiens is the emergence in Neanderthal of a second major resonance of 123 bases. We will observe that 123 is a Lucas number.
e) We finally notice that this resonance of 123 is subdivided into a triple symmetric substructure of periods 34 between 55 and 34.
f) For each of these 3 genomes the chromosomes4 have harmonic resonances which are attenuated as we move away from the major resonance 34. Neanderthal having 2 major resonances 34 and 123, the harmonic resonances between these 2 attractors (55 76 89) will attenuate less than their counterparts of Sapiens Build34. Curiously, this remark can be generalized to ALL harmonic resonances with the exception of the resonance 47 for which the chromosomes4 of Sapiens HG38 and Build34 are more optimal than that of Neanderthal (see figure below). A possible explanation could result from a superiority of the Sapiens resonance 34 on the Neanderthal resonance 34, a superiority that would propagate on the 2 neighboring harmonic resonances 47 of Sapiens and Neanderthal. Figure 48, Figure 49.
Figure 48.Here the 2 resonances 55 of Sapiens HG38 and Build34 have harmonic wavelengths much lower than the wavelength of the Neanderthal resonance 55.
Figure 49.Here the 2 resonances 47 of Sapiens HG38 and Build34 have harmonic wavelengths greater than the wavelength of the Neanderthal resonance 47.
3 – The Strange Case of Primates Chromosomes 4:
What happens to chromosomes4 of monkeys next to humans? Table 11
Table 11. Spread 1 / Phi for chromosome4 CG/TA ratios in humans and great apes.| Chromosomes4 of : | CG | TA | CG/TA | Ecart 1/Phi | Period recall |
| Sapiens (build34) | 71776628 | 115885048 | 0.6193778165 | -0.0013438278 | 34 |
| Sapiens HG38 (2013) | 72568001 | 117184666 | 0.6192619178 | -0.0012279291 | 34 |
| neanderthal | 71580883 | 115716180 | 0.6185900969 | -0.0005561082 | 34 and 123 |
| chimp | 70917081 | 115267557 | 0.6152388655 | 0.0027951232 | 21 |
| Uran utang | 70836032 | 115299667 | 0.6143645844 | 0.0036694043 | 21 |
| gorilla | 72543678 | 117432933 | 0.6177456029 | 0.0002883858 | 55 |
| Macaqua | 63330003 | 96885114 | 0.6536608193 | -0.0356268306 | 43 |
As with Sapiens and Neanderthal, the chromosome4 of these primates are here also the most "optimal" of the 34 chromosomes. In the chimpanzee, the urangutan and the gorilla, they are also characterized by a Fibonacci resonance. But this is no longer the case with the macaque. Figure 50, Figure 51, Figure 52, Figure 53, Figure 54, Figure 55, Figure 56, Figure 57.
Figure 50.The main resonance 21 of Chimp chromosome4.
Figure 51.The main period 21 of Chimp chromosome4.
Figure 52.The main resonance 21 of OrangUtan chromosome4.
Figure 53.The main period 21 of Chimp chromosome4.
Figure 54.The main resonance 55 of Gorilla chromosome4.
Figure 55.The main period 55 of Gorilla chromosome4.
Figure 56.The main resonance 43 of Macaqua chromosome4.
Figure 57.The main period 43 of Macaqua chromosome4.
We thus note that the chimpanzee and ourangutan have the same resonance as in 21, and their barcodes of periods are analogous. The gorilla, it has a very long resonance of 55. When the macaque, it seems more foreign with a resonance of 43, which is neither a Lucas number nor a Fibonacci number.
Discussion
In this chapter, we will analyze the limits of these exceptional properties of the chromosome4 of Sapiens and Neanderthal:
Does this global UNITY HGO and this hierarchy of chromosomes also extend to great apes?
Does this phenomenon of harmonic resonances of Fibonacci and Lucas also extend to great apes?
First analysis: Does this global UNITY HGO and this hierarchy of chromosomes also extend to great apes?
Here, we will be interested in the hierarchical spectrum of the 24 chromosomes, which we will recall that it varies between 1 / Phi for chromosome4 and 3 / 2Phi for chromosome 19, ie on a spectral amplitude of ½ Phi.
In addition we will distinguish the 2 humans (Sapiens, Neanderthal), the 3 apes (chimp, orangutan, gorilla),and the monkey (macaque). Table 12, Table 13, Table 14.
Table 12. Spread 1 / Phi for chromosome4 CG/TA ratios in humans and great apes.| chromosome4 | CG | TA | CG/TA | Ecart 1/Phi | Period recall |
| Sapiens HG38 | 72568001 | 117184666 | 0.6192619178 | ¯0.0012279291 | 34 |
| Sapiens BUILD34 | 71776628 | 115885048 | 0.6193778165 | -0.0013438278 | 34 |
| neanderthal | 71580883 | 115716180 | 0.6185900969 | -0.0005561082 | 34 and 123 |
| chimp | 70917081 | 115267557 | 0.6152388655 | 0.0027951232 | 21 |
| Orangutang | 70836032 | 115299667 | 0.6143645844 | 0.0036694043 | 21 |
| gorilla | 72543678 | 117432933 | 0.6177456029 | 0.0002883858 | 55 |
| Macaque | 63330003 | 96885114 | 0.6536608193 | -0.0356268306 | 43 |
| chromosome19 | CG | TA | CG/TA | Ecart 3/2 Phi :0.927050983 - (CG/TA) |
| Sapiens HG38 | 28015712 | 30425046 | 0.9208108346 | 0.0062401484 |
| Sapiens BUILD34 | 26989400 | 28819583 | 0.9364951603 | -0.0094441773 |
| neanderthal | 26980386 | 28805265 | 0.9366477274 | -0.0095967444 |
| chimp | 24934272 | 26870577 | 0.9279395824 | -0.0008885994 |
| Orangutang | 24686050 | 26681234 | 0.9252214497 | 0.0018295333 |
| gorilla | 23153144 | 24897410 | 0.9299418695 | -0.0028908865 |
| macaque | 22762699 | 24476186 | 0.929993709 | -0.002942726 |
| Genome | CG/TA Chr4 | CG/TA chr19 | Spectral Limits (CG/TA chr19)- (CG/TA Chr4) | Error : 0.3090169943 – Spectral Limits |
| Sapiens HG38 | 0.6192619178 | 0.9208108346 | 0.3015489168 | 0.0074680776 |
| Sapiens BUILD34 | 0.6193778165 | 0.9364951603 | 0.3171173438 | -0.0081003495 |
| neanderthal | 0.6185900969 | 0.9366477274 | 0.3180576305 | -0.0090406362 |
| chimp | 0.6152388655 | 0.9279395824 | 0.3127007169 | -0.0036837226 |
| Orangutang | 0.6143645844 | 0.9252214497 | 0.3108568653 | -0.001839871 |
| gorilla | 0.6177456029 | 0.9299418695 | 0.3121962666 | -0.0031792723 |
| macaque | 0.6536608193 | 0.929993709 | 0.2763328897 | 0.0326841046 |
It is observed that the 3 humans as well as the 3 apes apes are optimal vis-à-vis these 3 attractors. Only the macaque, more distant at the level of Evolution, moves away from these optimal theoretical attractors.
Second analysis: Does this phenomenon of harmonic resonances of Fibonacci and Lucas also extend to great apes?
The case of the chimpanzee:
Its major resonance is 21, does it have similar harmonic resonances of Fibonacci (34 55) or Lucas (29 47)? Figure 58, Figure 59, Figure 60, Figure 61, Figure 62, Figure 63, Figure 64, Figure 65.
Figure 58.Chimp chromosome4 harmonic Lucas resonance 29.
Figure 59.Chimp chromosome4 harmonic Fibonacci resonance 34.
Figure 60.Chimp chromosome4 harmonic Lucas resonance 47.
Figure 61.Chimp chromosome4 harmonic Fibonacci resonance 55.
Figure 62.Orangutan chromosome4 harmonic Lucas resonance 29.
Figure 63.Orangutan chromosome4 harmonic Fibonacci resonance 34.
Figure 64.Orangutan chromosome4 harmonic Lucas resonance 47.
Figure 65.Orangutan chromosome4 harmonic Fibonacci resonance 55.
The case of Orangutan: Its major resonance is 21, does it have similar harmonic resonances of Fibonacci (34 55) or Lucas (29 47)?
The case of the Gorilla: Its major resonance is 55, does it have harmonic resonances close to Fibonacci (21 34 89) or Lucas (29 47 76)? Figure 66, Figure 67, Figure 68, Figure 69, Figure 70, Figure 71.
Figure 66.Gorilla chromosome4 harmonic Fibonacci resonance 21.
Figure 67.Gorilla chromosome4 harmonic Lucas resonance 29.
Figure 68.Gorilla chromosome4 harmonic Fibonacci resonance 34.
Figure 69.Gorilla chromosome4 harmonic Lucas resonance 47.
Figure 70.Gorilla chromosome4 harmonic Lucas resonance 76.
Figure 71.Gorilla chromosome4 harmonic Fibonacci resonance 89.
The case of the Macaque: Its major resonance is 43, which is neither a Fibonacci number nor a Lucas number, does it have similar harmonic resonances of Fibonacci (21 34 89) or Lucas (18 29 47 76)? Figure 72, Figure 73, Figure 74, Figure 75.
Figure 72.Macaque chromosome4 Lucas resonance 18.
Figure 73.macaque chromosome4 quasi 21 Fibonacci resonance (21-1).
Figure 74.macaque chromosome4 quasi 29 Lucas resonance (29-1).
Figure 75.macaque chromosome4 quasi 34 Fibonacci resonance (34-1).
Conclusion
Finally, our various publications related to the Master Code of Biology highlight periodic laws, even undulatory, which would include DNA, genes, chromosomes and genomes 24, 25, 26, 27, 28.
In one hand, a large number of brain diseases 29 affect chromosome 4: Huntington 30, Wolf-Hirschhorn 31, Parkinson 32, neurodegenerative diseases such as Alzheimer's 33 or prions diseases 34 .
We note also the evidence of Golden Ratio in various physical and biological fields in Nature 35, 36, 37, 38, 39.
În other hand 2017 medicine prize winners are related to evidence of periodic processes controlling life and circadian clocks 40, 41, 42, 43, 44, 45.
We must now consider a probable periodic link between this chromosome4, the other chromosomes of the nuclear genome 8, and probably also the mitochondrial genome 18, and, perhaps brain and intelligence functions 46. Figure 76
Figure 76.physical harmonic resonance » analogy scenarii (thanks picture from Dr Robert Friedman).
Supplementary Data :
Acknowledgements
We especially thank Dr. Robert Friedman M.D. practiced nutritional and preventive medicine in Santa Fe, New Mexico, woldwide expert on Golden ratio Life applications (https://tinyurl.com/y9dxaauv ). We also thank the mathematician Pr. Diego Lucio Rapoport (Buenos aires), Marco F. Paya Torres (M.D Alicante), the french biologist Pr. François Gros (Pasteur institute,co-discoverer of RNA messenger with James Watson and Walter Gilbert ), Professor Sergey V. Petoukhov (Dr. Phys.-Math. Sci, Grand Ph.D., Full Professor, Laureate of the State prize of the USSR), Volkmar Weiss (Dr. rer. nat. habil. Dr. phil. Habil. Leipzig, Germany), M.V Ramanujam. SVP-GLOBAL BUSINESS BIONEEDS India , Dr Andras J. Pellionisz, Ph.D. Founder, HolGenTech, Inc. Sunnyvale, Silicon Valley, California, Dr E.G. Rajan, Pentagram India (grandson of math genius Ramanujan https://en.wikipedia.org/wiki/Srinivasa_Ramanujan ), and Pr. Luc Montagnier, medicine Nobel prizewinner for their interest in my research of biomathematical laws of genomes.
References
- 1.Wu Jun.(2016),In vivo genome editing via CRISPR/Cas9 mediated homology-independent targeted integration. doi: 10.1038/nature20565. Nature(16November2016) |
- 2.Kellie A Schaefer. (2017) Unexpected mutations after CRISPR-Cas9 editing in vivo,Nature Methods. NatureMethods 14, 547–548.doi: 10.1038/nmeth.4293 Published online30May2017
- 3.J C Perez. (2017) Symmetry and Asymmetry in the MENDELEEV’s Periodic Table Predictive EQUATION(2017)SDRP. , Journal of Computational Chemistry & Molecular Modelling 2(1).
- 4.Lieberman-Aiden. (2009) Comprehensive mapping of long-range interactions reveals folding principles of the human genome. doi:. 10.1126/science.1181369. Science2009
- 5.Pellionisz A J, Graham R, Pellionisz P A. (2012) Recursive Genome Function of the Cerebellum:. Geometric Unification of Neuroscience and Genomics.In:Manto,M,DL,etal. (Eds).Handbook of the Cerebellum and Cerebellar Disorders.1st(Edn),Springer,USA .
- 6.perez.DUF1220 Homo Sapiens and Neanderthal fractal periods architectures breakthrough(2017)SDRP. , Journal of Cellular and Molecular Physiology 1(1).
- 7.J C Perez.Fractal Self-similarity, Scale Invariance and Stationary waves Codes Architecture Human Chromosomes DNA sequences. (to be published)
- 8.J C Perez. (2017) Global and long range fractal differences between sapiens and neanderthal genomes”. to be published in2017
- 9.Perez J C. (1991) Chaos DNA and neuro-computers: a goldenlink.Speculationsin Science andTechnology14:. 336-346.
- 10.Marcer P J. (1992) . Orderand chaos in DNA – the Denis GuichardPrizewinner:Jean-Claude Perez.Kybernetes21: 60-61.
- 11.Perez J C. (1997) L’adn Décrypté. Resurgence publisher Liege,https://www.amazon.co.uk/LADN-d%C3%A9crypt%C3%A9-d%C3%A9couverte-preuves-langage/dp/2872110178/ref=asap_bc?ie=UTF8.Belgium
- 12.Perez J C. (2009) Codex Biogenesis. Resurgence, Liege Belgium.https://www.amazon.fr/Codex-Biogenesis-13-codes-lADN/dp/2874340448.
- 13.Perez J C. (2010) . Codon Populations in Single-StrandedWholeHumanGenomeDNA Are Fractal and Fine-Tunedby the Golden Ratio 1.618.InterdisciplinarySciences:ComputationalLife Sciences 2, 1-13.
- 15.Perez J C. (2011) DecodingNon-Coding DNA Codes: HumanGenomeMeta-Chromosomes Architecture. BIT Life Sciences’ 3rdAnnualWorld VaccineCongress,Beijing,China .
- 16.Perez J C. (2013) . The “3GenomicNumbers” Discovery: How OurGenomeSingle-StrandedDNASequenceIs “Self-Designed” as aNumericalWhole.AppliedMathematics4: 37-53.
- 17.J C Perez. (2017) A proof of the unity, integrity and autopoietic autonomy of the whole human genome. (to be published)
- 18.Perez J C. (2017) Sapiens Mitochondrial DNA Genome Circular Long Range Numerical Meta Structures are Highly Correlated with Cancers and Genetic Diseases mtDNA Mutations. , J Cancer Sci Ther 9, 512-527.
- 19.Perez J. (2015) Deciphering Hidden DNA Meta-Codes -The Great Unification &. , Master Code of Biology. J Glycomics Lipidomics 5, 131-10.
- 20.J C Perez. (2017) The Human Genome Optimum (HGO): towards a Universal Law controlling all Human Cancer Chromosome LOH Deletions (Loss Of Heterozygosity). (to be published)
- 24.J C Perez. (2015) Decyphering “the MASTER CODE ” Structure and Discovery of a Periodic Invariant Unifying. 160 HIV1/HIV2/SIV Isolates Genomes. BJSTR. MS.ID.000209. Biomed J Sci and Tech Res 1(2).
- 25.J C Perez. (2017) The theoretical prediction of the mutagenic regions of the p53 tumor suppressor gene (to be published).
- 26.Perez J C. (2017) The “Master Code of DNA”: Towards the Discovery of the SNPs Function (Single-Nucleotide Polymorphism). , J Clin Epigenet 3, 26.
- 27.J C Perez. (2017) The “Master Code of Biology”: Self-assembly of two identical Peptides beta A4 1-43 “Amyloid” in Alzheimer’s Diseases. , Biomed J Sci & Tech Res 1(4).
- 28.J C Perez. (2017) The “Master Code of Biology”: from Prions and Prions-like Invariants to the Self-assembly Thesis. , Biomed J Sci & Tech Res 1(4).
- 29.Agrawal M, Biswas A. (2015) Molecular diagnostics of neurodegenerative disorders. Frontiers. in Molecular.http://doi.org/10.3389/fmolb.2015.00054
- 30.. (2017).Mayo clinic,Huntington disease.http://www.mayoclinic.org/diseases-conditions/huntingtons-disease/home/ovc-20321431
- 31.NIH USA Library of Medicine (2017) . Wolf-Hirschhorn syndromehttps://ghr.nlm.nih.gov/condition/wolf-hirschhorn-syndrome
- 32.NIH/National InstituteOn Aging (203), Major New Finding On Genetics Of Parkinson’s Disease Zeroes In On Activity Of Alpha Synuclein.
- 33.Wiwanitkit Viroj. (2013) Physiological genomics analysis for Alzheimer's disease. , Ann Indian Acad Neurol.2013.Jan-Mar 16(1), 72-74.
- 34.Conrad O Iyegbe. (2010) Evidence for Varied Aetiologies Regulating the Transmission of Prion Disease: Implications for Understanding the Heritable Basis of Prion Incubation Times,Published:December2,2010.
- 35.Friedman R, Cross M. (2013) The Golden Ratio and Fibonacci Sequence: Golden Keys to Your Genius, Health, Wealth and Excellence.1st(Edn),HoshinMedia,USA.
- 36.Rapoport D L. (2015) Möbius strip and Klein Bottle Genomic Topologies, Self reference, Harmonics and Evolution. , Life
- 37.Montagnier L. (2017) Water Bridging Dynamics of Polymerase Chain Reaction in the Gauge Theory Paradigm of Quantum Fields. doi: 10.3390/w9050339.http://www.mdpi.com/2073-4441/9/5/339/pdf. Water2017. 9(5): 339.
- 38.Persaud Dharam, James P O’Leary. (2015) . Fibonacci Series, Golden Proportions, and the Human Biology. HWCOM Faculty Publications.http://digitalcommons.fiu.edu/com_facpub/27. Paper27 .
- 39.Roman V Yampolskiy. (2017) On the origin of synthetic life: attribution of output to a particular algorithm,The Royal Swedish Academy of Sciences. doi: 10.1088/0031-8949/92/1/013002. , Phys. Scr 92.
- 41.W A Zehring, D A Wheeler, Reddy P, R J Konopka, C P Kyriacou et al. (1984) P-element transformation with period locus DNA restores rhythmicity to mutant, arrhythmic Drosophila melanogaster. , Cell 39, 369-376.
- 42.Liu X, L J Zwiebel, Hinton D, Benzer S, J C Hall et al. (1992) The period gene encodes a predominantly nuclear protein in adult Drosophila. , J Neurosci 12, 2735-2744.
- 43.J L Price, Blau J, Rothenfluh A, Abodeely M, Kloss B et al. (1998) double-time is a novel Drosophila clock gene that regulates PERIOD protein accumulation. , Cell 94, 83-95.
- 44.Ramkisoensing A, J H Meijer. (2015) Synchronization of Biological Clock Neurons by Light and Peripheral Feedback Systems Promotes Circadian Rhythms and Health. Frontiers in Neurology.6(128).